


Next: Experiment: The OCTCA and
Up: Frequency Response of Simple
Previous: Transistor Intrinsic Capacitance
From the above equivalent circuit, we could use KVL and KCL to
rigorously analyze the small signal response. However,
once we have more than one transistor in a circuit, such
an approach becomes impractical, and designers usually
opt for approximate methods.
As can be seen,  is actually a Miller capacitance,
and we can analyze it as such. However, another approach
to analyze these effects is the Open Circuit Time Constant
Analysis (OCTCA), which we will introduce here.
is actually a Miller capacitance,
and we can analyze it as such. However, another approach
to analyze these effects is the Open Circuit Time Constant
Analysis (OCTCA), which we will introduce here.
Very often a circuit contains a dominant pole which largely
determines its high-frequency characteristics.
The OCTCA gives a methodology for
approximating the value
of this dominant pole.
With the OCTCA, you
account for the effect of
one high-frequency capacitor at a time. You do this
by determining the resistance seen by  , while
assuming is not there (open circuited). You then
repeat the process by determining the
resistance seen by , while open circuiting .If there were more high frequency capacitors in the circuit,
you would repeat this process for each capacitor.
The high frequency response is then approximated by
a low pass filter with a single pole
, while
assuming is not there (open circuited). You then
repeat the process by determining the
resistance seen by , while open circuiting .If there were more high frequency capacitors in the circuit,
you would repeat this process for each capacitor.
The high frequency response is then approximated by
a low pass filter with a single pole
| 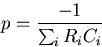 |
(87) |
Where Ri is the resistance seen by Ci with all other
high frequency capacitors shorted.
The OCTCA approach is probably best illustrated through example.
Consider the CE amp in Fig. 4.11
Figure 4.11:
Circuit for Illustrating OCTCA
 |
Let's start by drawing the small signal equivalent circuit which is
shown
in Fig. 4.13.
Figure 4.12:
Small Signal Equivalent Circuit Illustrating OCTCA
 |
Notice that we have explicitly included the intrinsic capacitors
and . Now, we can divide the capacitors into two
groups. The first group tend to give rise to higher voltage gain
as the frequency increases. This group consists of C1, C2 and
CE. The second group causes the gain to decrease as frequency
increases. This group consists of and .Now, let's consider only frequencies which are so high that
C1, C2 and CE can be considered short circuits.
Under these circumstances the small signal equivalent circuit
is shown in Fig. 4.13
Figure 4.13:
CE High Frequency Small Signal Equivalent Circuit
 |
Of course we could now analyze this circuit formally using
loop equations to obtain the voltage gain as a function
of frequency. However, once circuits contain more than one
transistor, such analyses become very tedious, and are
usually best done numerically. Here, we illustrate the OCTCA which
is easily extendible to complex circuits.
As mentioned above, with the OCTCA we open all capacitors and
short the input.
Then, we determine resistance seen by the capacitor under
consideration. Let's start with
.
First we open
.
The resistance
sees
with
open
is then
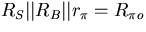 .So, the contribution due to capacitor
can be approximated with the time constant
.So, the contribution due to capacitor
can be approximated with the time constant
 .
.
Determining the resistance seen by
is not quite as obvious due to the dependent
current source.
To determine this resistance, which we will designate
 ,
we first open , and then replace
with a current source and determine
the voltage developed across it.
The situation is illustrated in Fig. 4.14.
,
we first open , and then replace
with a current source and determine
the voltage developed across it.
The situation is illustrated in Fig. 4.14.
Figure 4.14:
Circuit for determining resistance seen by
 |
In this figure, ix is the value of the test current source which replaces
, and v1-v2 is the voltage developed
across ix.
Also in the figure RL'=RC||RL and  is the voltage across
 .The resistance
seen by is thus given by
.The resistance
seen by is thus given by
| 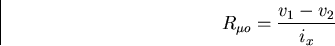 |
(88) |
To find in terms of known quantities apply Kirchoff's
laws.
|  |
(89) |
| 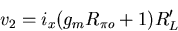 |
(90) |
Therefore, the resistance seen by
is
| 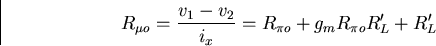 |
(91) |
Thus, the time constant associated with
is  .
.
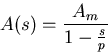
Using the OCTCA, we approximate the
high frequency response of the circuit with a first
order low pass filter with
a pole p at
|  |
(92) |
The voltage gain A(s) of the circuit at high frequencies is thus
approximated by
|  |
(93) |
Where Am is the midband gain.
Next: Experiment: The OCTCA and
Up: Frequency Response of Simple
Previous: Transistor Intrinsic Capacitance
Neil Goldsman
10/23/1998