Overall Average SA/Lipid
(authors: Xiaohong Zhuang & Jeffery Klauda)
Introduction
This simple analysis is used to estimate the overall average surface area (SA) per lipid. If you are analyzing a single component membrane then this is equivalent to the component's SA/lipid. Otherwise, this is the average of all lipids.
Those at UMD should use the ZT1 path: /afs/shell.umd.edu/project/energybio/shared/jbklauda/scripts/area_1_lipid
Outside of UMD a sample script is given in the gzip file: area_1_lipid.gz
Example of analysis result in an Excel File: e.g._sa_1_lipid.xlsx
Instructions
1. Copy the folder area_1_lipid from the path highlighted above to your directory has contains all dyn files. area_1_lipid should become a subdirectory of your folder with the dyn*.dcd files.
1.1 Update area2.scr: Change the 100 in line 23 (area=($2*$2)/100) to your system value for the # lipid per leaflet
2. The next set of instructions assume that you are running commands from the command line in the area_1_lipid folder.
2.1. 1_run_area.scr : This script is used to calculate the surface area per lipid starting from beginning (all dyns). The key steps of 1_run_area.scr file are shown below:
 # Run area2.scr to obtain the area starting from beginning in time step
./area2.scr

# Convert times steps to ns (assume 2fs/time which is always the case), and calculate the accumutive average of area
awk '{time=($1)*0.000001} {printf "%i\t%2.3lf\t%.2lf\t%.2lf\n",$1,time,$2,(p+=$2)/NR}' area_all_ns.dat > area_time_acc.dat

# Generate the data file for plotting in excel
sed -n '1~50p' area_time_acc.dat > area_time_acc_excel.dat
- area2.scr is used to obtain the areas from the the first dyn file (likely dyn1.xst) to the end
- The
awkline creates of time series of the area assuming time is in fs - the
sedline reduces the printing of data (every 50 lines) in a reduced file…this may not be needed if the printout is not frequent.
You will need to run the scr file with type the following on the command line: ./1_run_area.scr
After run 1_run_area.scr, the files area_time_acc.dat and area_time_acc_excel.dat will be generated. For area_time_acc.dat, the first column is time in nanosecond (ns), the 2nd column is the surface area per lipid at each time (step), and the 3rd column is the cumulative average of surface area per lipid.
2.2. Generate the plot of area vs. time in order to estimate the time the system reaches equilibrium with respect to the SA/lipid.
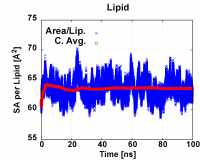
2.2.1. Using GnuPlot on LINUX: ./2_plot_sa.scr command is to use Gnuplot to generate plot 2_sa.tif. An example of the plot is shown below.
 Figure 1. Example surface area per lipid plot
It is recommended to adjust the GnuPlot script to adjust the axis scale to best represent your data. Using nano or vim as an editor of 2_sa.gnu
# show margin
plot [0:100] [35:50] \
'area_time_acc.dat' using 2:3 with point  pt 2 ps 2 lw 4 lc rgb 'blue' title '{/DejaVuSerif-Bold=45 Area/Lip.}', \
'area_time_acc.dat' using 2:4 with point  pt 6 ps 3 lw 4 lc rgb 'red'  title '{/DejaVuSerif-Bold=45 Cm. Avg.}'
The ranges after the plot command can be adjusted for the time (in ns) and SA. The other lines can be adjusted to format personally desired.
2.2.2. You can also use Excel to plot area_time_acc_excel.dat in Excel. The example of the plot in Excel is attached.
2.3. Estimating time for equilibration.
Based on the area plot, you can determine when (at which dyn) the system reaches equilibrium. The equilibrium dyn number is the dyn file number that your cumulative (or running) average surface area per lipid (sa/lip) (red data points in Fig.1) becomes constant (i.e 10-15 dyn, refer to note). Since the running average including the beginning high values, we will also determine equilibrium based on the area per lipid (blue data points in Fig.1) that fluctuate around the same center line).
For in Fig.1, the cumulative average area (red) indicate that system reach equlibrium at around 30ns, and the areas (blue) fluctuate around the same center line, so we use the data from 50-100ns (dyn 26-50) or 60-100ns(dyn 31-50) to calculate the average area/lip. You will need to do the same for your system.
3. Obtaining Statistics of SA/Lipid
Based on equilibrated dyn range determined in Step 2.3, select the data points from equilibrated dyn to the end to calculate the block-average surface areas.
3.1 3_cal_avg_std.scr
Update the total number of last dyn*.dcd files to calculated the averages.
set Ndyn = 20
The example states that you want to do the averages from the last 20 dyn*dcd files. Let's say you have 50 dyn*.dcd files, then the first 30 files are ignored. If each file had 2ns of data, then you are calculating the average from 60-100ns.
3.2 Calculate the block-average surface areas by command: ./3_calc_avg_std.scr
Note: For #define MAX_R 1000000 in area-block.c, you might have to change the number to a larger one (larger than your # data points) and recompile it.
As you can see, the output average area data are saved in area_avg_std.dat. The result is given in average+- population standard deviation.
3.3 Standard Errors from Block Average
Calculate averages, sample standard deviation, and standard error of block averages by command: ./4_run_calc_sterr.scr
The file avg_stderr.dat will be generated that will show the final values that we need, which are the average of the block averages and the standard error of the block averages, i.e. SA_avg/lip +- Standard error. You may refer to the attached Excel file which also demonstrate how the standard error is calculated if you are interested.
