Created by Tyler Cline
Uploaded By Robert Allsopp
Download the files from here psi_phi_alpha_beta.tar this is the source of where the method was developed conformations.tar
You'll need to upload the phipsi.txt script. This is a tcl script used for vmd console. I have hardcoded it to register the .psf file to be “step3_pbcsetup.psf” and to use the trajectory files named “ds.job*.0.dcd”. The asterisk represents the range of files so my trajectory files from the rest simulations outputted as ds.job0.0.dcd, ds.job1.0.dcd, ds.job2.0.dcd, etc… If your trajectory files have a different name you'll need to change the “filename” input for the script and also possibly the line starting with “mol addfile” (again sorry it's really confusing). So in order to create the phipsi data you'll need to do these steps:
- upload phipsi.txt into the directory containing the trajectory files
- module load vmd (then access vmd by typing “vmd” on the command line)
- type “source phipsi.txt”
- type “phipsi (starting trajectory number) (ending trajectory number) (filename [ex: ds.job]) (optional: output data file name)”
If done correctly, it should run through the files fairly quickly and you should see your data file outputted. I attached an example output file “dh_phipsi_0_25.txt”
Ramaplot
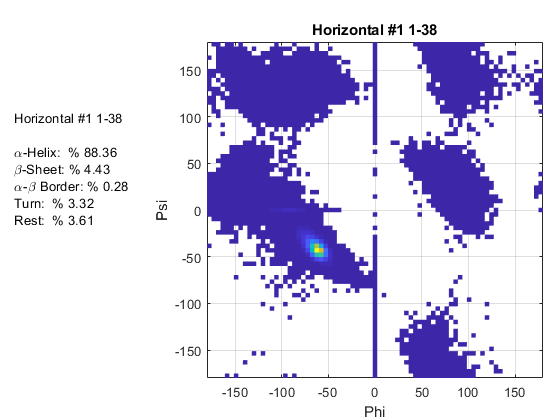
Now for the actual plotting… Once you get the data files for all the trajectory ranges you want, you'll need to transfer these files onto your computer. The matlab code is attached called “ramaplot”. The only edits you'll have to make are the variables “file” and “titlelist”. These are arrays containing the file names and corresponding graph titles for the data you collected. So you'll just need to change these to be the phipsi outputted data file names and then make sure to match up the corresponding title (they go in the same order).
Preferable Analysis
Now, there is another method of phipsi data analysis that takes a look at 4 residues at a time as a single group. Ramaplot looks at the phipsi angles of each residue individually and if it fits the certain range of secondary structure it counts it, however, this other method of analysis takes the group of 4 residues and only counts it as a certain secondary structure if ALL 4 residues in the group fit in the category. Dr. Klauda found an article that referenced this as a preferable analysis method. I hardcoded this file for my system of 24 resides. So the changes you'll need to make in addition to the file names are:
- line 23: frames = x/(# of residues)
- line 27: k = 1:(# of residues - 3)
- line 59 & line 60: ((# of residues +1):end)
Attached: - conformations.pdf (reference for phipsi ranges)

