Table of Contents
Brief instruction to obtain lipid wobbble correlation times
Authors: Xiaohong Zhuang, Viviana Monje and Dr. Jeffery B. Klauda
This brief instruction is used to calculate the time scale of lipid wobble, which describes the lipid mobility, and by calculating the correlation time (tau) of the cross-tail vectors of glycerol phospholipids (C22-C32) or sphingolipids (C4S-C2F). This could be adjusted to any vector of interest by changing the atom selection
Download scripts: wob-s.tar.gz
Download example: wob-e.tar.gz
If on ZT1, use the files in the following directory: /afs/shell.umd.edu/project/energybio/shared/jbklauda/scripts/lip_wobble/
Calculate the correlation function
1. Update correl.csh to your system
# Update the path of the input psf, crd file
set p = /lustre/xzhuang/simulation/lipids/dmpi/charmm-gui

# Update Name of the atoms, use C22 and C32 for phospholipids, and C4S and C2F for sphingolipids
set atm1 = C22
set atm2 = C32

# Update Nf, number of frames per dcd file
set Nf = 1000
2. Update set-range.str
! Update the following numbers
set rn = DMPI   ! Update the resname of lipid
set type = G   ! Update lipid type, put G for glycerol lipids, S for sphingolipids
set ti = 21      ! first trajectory
set tf = 50      ! last trajectory

! Manually update the numbers if the top and bottom in your system are not symmetric
calc Nh = @Nlip / 2   ! Calculate number of lipids on the top/bot leaflet
calc Nb = @Nh + 1    ! Calculate number of beginning bottom leaflet subset
Note:
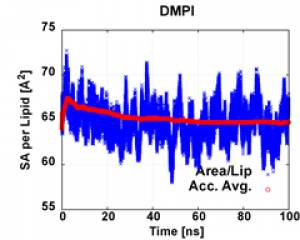
The example simulation has 50 dcd, with each dcd 1,000,000 time steps (i.e. 2ns), therefore total simulation time is 100 ns. Unlike other analyses, we need to use the longest possible equilibrated time range to calculate correlation function (usually 40% or more). Here, the last 60% (last 60 ns, i.e. 60ns~100 ns) is used to calculate the correlation function (as SA/lipid indicates that the system reach equilibrium at by 60 ns).
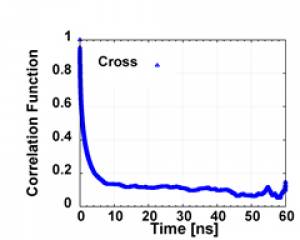
As you can see in the graph of the example correlation function output in corr directory, the correlation is very weak in the tail, so we only use the last 65%~90% to do the exponential fitting to obtain the correlation time tau ( and also to calculate T1). As you can see the following in expfit/1_line_sed.scr
linenew=$(( $line * 3 / 4 ))
3. Submit the analysis job by command: correl.scr
After run finished, the cross-top.dat and cross-bot.dat will be obtained in the corr directory. The first column is the time in ps, and the second 2nd is the correlation function C2(t).
4. Go to corr directory, then calucate the top and bottom leaflet average by command 1_comb_avg.scr
5. Adjust the time range (axis) in 2_correl.gnu, then plot the correlation function by command 1_comb_avg.scr (if you use WinSCP), otherwise, you may plot it in Excel or any other software you like.
Fitting correlation function to exponential functions
1. Go to expfit directory, obtain the last 80% of correlation by command 1_line_sed.scr
2. Run the exponential fit by command 2_expfit.csh
The current scripts fitting both 2nd order exponential function since it fitting the 2nd order exponential is more likely to work than the 3rd order fitting based on my experience. The results from the two types of fitting are generally close. In both fittings, the longest correlation time corresponds to lipid wobble movement time scale.
In cross-fit2.dat, CF values in the end are, a1 plateau a2 t1 t2, the longest time scale t2 (i.e. CF(4) ) is what we need. In cross-fit3.dat, CF values in the end are, a1 a2 plateau a3 t1 t2 t3, the longest time scale t3 (i.e. CF(6) ) is what we need.
If the fitting work fine, you will see the statement “STOP Normal Exit statement executed” on the screen.
If the 2nd order fitting did not go well, the following two things that you can try. But please discuss with Dr.Klauda about these.
a. Adjust the portion of correlation function to fit by modify the 1_line_sed.scr.
The current script uses first 75% data in the following line, you may change it to 80% (must use integer fraction format instead of floating point (decimal) here, i.e. 4/5), or 90% (9/10), or any other fraction depends your correlation function graph.
linenew=$(( $line * 3 / 4 ))
b. Use longer equilibrated time trajectory range by adjust ti value in set-range.str, and redo the correlation function calculation.
3. This step is just to check the wellness of the fitting.
You may adjust the time range (axis) in 3_expfit_cross.gnu, then plot the correlation function and its exponential fitting by command 3_plot_expfit.scr (if you use WinSCP), otherwise, you may plot it in Excel or any other software you like.
bilayer wobble
Please make the following edits to adjust the code for individual lipids to all glycerol lipids. (Sphino lipids would need to be calculated separately, by adjusting the cross-chain vector atom selection in correl.csh)
1. set-range.str
a. delete or comment out the following line. No need to specify lipid if for overall bilayer wobble
! set rn = xxx
b. change lipid count/selection. With type C32, we are able to select all glycerol lipids.
if @type .eq. G then
        define lipid select type C32 end     ! all glycerol lipids
2. cross-*.inp
a. change vector atom selection line.
change this line
enter v@K vect xyz MEMB @R @atm1 MEMB @R @atm2
to
enter v@K vect xyz sele resid @R .and. (type @atm1 .or. type @atm2) end
3. everything else the same as above sections


