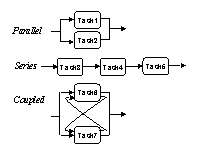
| Three Configurations that Characterize a System | ||||||||||||||||||||||||||||||
| Relationship | Parallel | Sequential | Coupled | |||||||||||||||||||||||||||
| Graph Representation |  |
|
 |
|||||||||||||||||||||||||||
| DSM Representation |
|
|
|
|||||||||||||||||||||||||||
TABLE OF CONTENTS
WHAT IS A DESIGN STRUCTURE MATRIX (DSM)?
A design structure matrix (DSM) is a compact, matrix representation of a system or project. The matrix contains a list of all constituent subsystems/activities and the corresponding information exchange and dependency patterns (i.e., what information pieces (parameters) are required to start a certain activity and where does the information generated by the activity feed into).
A LITTLE BIT OF HISTORY
The use of matrices in system modeling can be traced back to Warfield in the 70s and Steward in the 80s. However, it is not until the 1990s that the method received attention and wide spread. Much of the credit in its current popularity is accredited to MIT's research in the design process modeling arena.
Earlier works started with the use of graphs for system modeling. For example, consider a system that is composed of two elements (or sub-systems): element "A" and element "B". [The two elements are assumed to completely describe the system and characterize its behavior]. A graph may be developed to represent this system pictorially. The system graph is constructed by allowing a vertex/node on the graph to represent a system element and an edge joining two nodes to represent the relationship between two system elements. The directionality of influence from one element to another is captured by an arrow instead of a simple link. The resultant graph is called a directed graph or simply a digraph.
The use of matrices in system modeling can be traced The matrix representation of a digraph (i.e. directed graph) is a binary (i.e., a matrix populated with only zeros and ones) square (i.e. a matrix with equal number of rows and columns) matrix with m rows and columns, and n non-zero elements, where m is the number of nodes and n is the number of edges in the digraph. The matrix layout is as follows: the system elements names are placed down the side of the matrix as row headings and across the top as column headings in the same order. If there exists an edge from node i to node j, then the value of element ij (column i, row j) is unity (or marked with an X). Otherwise, the value of the element is zero (or left empty). In the binary matrix representation of a system, the diagonal elements of the matrix do not have any interpretation in describing the system, so they are usually either left empty or blacked out.
KEY BENEFITS OF DSM
In a nut shell, binary matrices for system modeling are useful in systems modeling because they can represent the presence or absence of a relationship between pairs of elements of a system. A major advantage of the matrix representation over the digraph is in its compactness and ability to provide a systematic mapping among system elements that is clear and easy to read regardless of size.
If the system is a project represented by a set of tasks to be performed, then off-diagonal marks in a single row of the DSM represent all of the tasks whose output is required to perform the task corresponding to that row. Similarly, reading down a specific column reveals which task receives information from the task corresponding to that column. Marks below the diagonal represent forward information transfer to later (i.e. downstream) tasks. This kind of mark is called forward mark or forward information link. Marks above the diagonal depict information fed back to earlier listed tasks (i.e. feedback mark) and indicate that an upstream task is dependent on a downstream task.
There are three basic building blocks for describing the relationship amongst system elements: parallel (or concurrent), sequential (or dependent) and coupled (or interdependent).
| Three Configurations that Characterize a System | ||||||||||||||||||||||||||||||
| Relationship | Parallel | Sequential | Coupled | |||||||||||||||||||||||||||
| Graph Representation | |
|
|
|||||||||||||||||||||||||||
| DSM Representation |
|
|
|
|||||||||||||||||||||||||||
Points to note are as follows:
READING THE DSM
The DSM provide insights about how to manage a complex system/project and hilights issues of information needs and requirements, task sequencing, and iterations. A sample DSM is shown below:
| ACTIVITIES | A | B | C | D | E | F | G | H | I | J | K | L | M | N | |
| Receive specification | A | A | |||||||||||||
| generate/select Concept | B | X | B | ||||||||||||
| Design beta cartridges | C | X | X | C | |||||||||||
| Produce beta cartridges | D | X | D | ||||||||||||
| Develop testing program | E | X | X | X | E | ||||||||||
| Testbeta cartridges | F | X | X | X | F | ||||||||||
| Design prod'n cartridge | G | X | X | X | X | G | X | X | |||||||
| Designmold | H | X | X | X | X | H | X | ||||||||
| Designassembly tooling | I | X | X | I | |||||||||||
| Purchase MFG equipment | J | X | X | X | J | ||||||||||
| Fabricate molds | K | X | K | ||||||||||||
| Debug molds | L | X | X | X | L | ||||||||||
| Certify cartridge | M | X | X | M | |||||||||||
| Initial production run | N | X | X | X | N |
The X marks indicate the existence and direction of information flow (or a dependency in a general sense) from one activity in the project (i.e. matrix) to another. Reading across a row reveals the input/dependency flows by an X mark placed at the intersection of that row with the column that bears the name of the input task. Reading across a column reveals the output information flows from that activity to other activities by placing an X in a similar manner described above. For example, consider activity C in the above matrix. Activity C relies on information from activities A and B and delivers information to activities D, E, F and G.
The green marks (below the diagonal) represent forward flow of information. The red marks (above the diagonal) are of special significance. Such a mark reveal a feedback from a later (i.e. downstream) activity to an earlier (i.e. upstream) one. This means that the earlier activity has to be repeated in light of the late arrival of new information.
This iterative process in common in most engineering design and development projects. Design iterations create rework and require extra comunication and negotiation which result in a prolonged development process. In order to speed up this iterative design process, the DSM methodology suggests the manipulation of the matrix elements such that iterative behavior is removed from the matrix, or at least minimized (a process called partitioning -- see details below.
It is worth noting that some DSM researchers and practitioners use an opposite convention for the feedforward and feedback marks, as discussed above. That is, the DSM can be built in such a way that sub-diagonal marks represent feedback (MIT DSM Lab).
Design structure matrices can be used to represent four different types of data:
| DSM Data Types | Representation | Application | Analysis Method |
| Component-based | Multi-component relationships | System architecting, engineering and design | Clustering |
| Team-based | Multi-team interface characteristics | Organizational design, interface management, team integration | Clustering |
| Activity-based | Activity input/output relationships | Project scheduling, activity sequencing, cycle time reduction | Sequencing & Partitioning |
| Parameter-based | Parameter decision points and necessary precedents | Low level activity sequencing and process construction | Sequencing & Partitioning |
COMPONENT-BASED DESIGN MATRICES
A component-based DSM documents interactions between elements in a complex system
architecture. Different types of interactions can be displayed in the DSM. Types of
interactions will vary from project to project.
Some representative interaction types are shown in the table below (Pimmler and Eppinger, 1994).
| Spatial | needs fort adjacency or orientation between two elements |
| Energy | needs for energy transfer/exchange between two elements |
| Information | needs for data or signal exchange between two elements |
| Material | needs for material exchange between two elements |
As an example, consider the material interaction between components for an automobile Climate Control System.
| A | B | C | D | E | F | G | H | I | J | K | L | N | M | O | P | ||
| Radiator | A | A | X | ||||||||||||||
| Engine fan | B | X | B | ||||||||||||||
| Heater Core | C | C | X | ||||||||||||||
| Heater Hoses | D | D | |||||||||||||||
| Condenser | E | X | E | X | X | ||||||||||||
| Compressor | F | X | F | X | X | ||||||||||||
| Evaporator Case | G | G | X | ||||||||||||||
| Evaporator Core | H | X | X | H | X | X | |||||||||||
| Accumulator | I | X | X | I | |||||||||||||
| Refrigeration Controls | J | J | |||||||||||||||
| Air Controls | K | K | |||||||||||||||
| Sensors | L | L | |||||||||||||||
| Command Distribution | M | M | |||||||||||||||
| Actuators | N | N | |||||||||||||||
| Blower Controls | O | O | X | ||||||||||||||
| Blower Motor | P | X | X | X | X | P |
Clustering the "X" marks along the diagonal of the DSM resulted in the creation of three "chunks" for the Climate Control System. The "chunks" are (Pimmler and Eppinger, 1994): (1) Front End Air Chunk; (2) Refrigerant Chunk; (3) Interior Air Chunk.
| D | J | K | L | M | N | A | B | E | F | I | H | C | P | O | G | ||
| Radiator | D | D | |||||||||||||||
| Engine fan | J | J | |||||||||||||||
| Heater Core | K | K | |||||||||||||||
| Heater Hoses | L | L | |||||||||||||||
| Condenser | M | M | |||||||||||||||
| Compressor | N | N | |||||||||||||||
| Evaporator Case | A | A | X | ||||||||||||||
| Evaporator Core | B | X | B | X | |||||||||||||
| Accumulator | E | X | E | X | X | ||||||||||||
| Refrigeration Controls | F | X | F | X | X | ||||||||||||
| Air Controls | I | X | I | X | |||||||||||||
| Sensors | H | X | X | X | H | X | |||||||||||
| Command Distribution | C | C | X | ||||||||||||||
| Actuators | P | X | X | P | X | X | |||||||||||
| Blower Controls | O | X | O | ||||||||||||||
| Blower Motor | G | X | G |
TEAM-BASED DESIGN MATRICES
This approach is used for organizational analysis and design based on information flow among various organizational entities. Individuals and groups participating in a project are the elements being analyzed (rows and columns in the matrix). A Team-based DSM is constructed by identifying the required communication flows and representing them as connections between organizational entities in the matrix. For the modeling exercise it is important to specify what is meant by information flow among teams. The table, below, presents several possible ways information flow can be characterized.
| Flow Type | Possible Metrics |
| Level of Detail | Sparse (documents, e-mail) to rich (models, face-to-face) |
| Frequency | Low (batch, on-time) to high (on-line, real) |
| Direction | one-way to two-way |
| Timing | Early (preliminary, incomplete, partial) to late (final) |
The matrix can be manipulated in order to obtain clusters of highly interacting teams and individuals while attempting to minimize inter-cluster interactions. The obtained groupings represent a useful framework for organizational design by focusing on the predicted communication needs of different players.
For an application example, refer to McCord and Eppinger (1993). They propose a team-based DSM to analyze the organizational structure necessary for an improved automobile engine development process.
ACTIVITY-BASED DESIGN MATRICES
Three types of task interactions can be observed from the matrix. In the figure, below, tasks 1 and 2 are "independent" since no information is exchanged between them. These tasks can be executed simultaneously (in parallel). Tasks 3, 4, and 5 are engaged in a sequential information transfer and are considered "dependent". These tasks would typically be performed in series. Tasks 7 and 8, however, are mutually dependent on information. These are "interdependent" or "coupled" tasks often requiring multiple iterations for completion.
A Sample Task-Based DSM
|
 |
Marked cells above the diagonal represent iterations in the process. This occurs when an activity is dependent on information from a task scheduled for a later execution. Such scenarios often lead to rework and are undesirable. A number of algorithms have been developed (Warfield, 1973; Steward, 1981) to minimize such instances of iteration (above diagonal marked cells) by re-arranging the sequence of tasks in the process. Methods are also available on how to handle iterations in the process that cannot be eliminated through re-sequencing.
DSM models using simple binary representations strictly display the existence of a dependency between two tasks without providing additional information on the nature of the interaction. Further studies have extended the basic DSM configuration by capturing additional facts on the development process. For example, the numerical DSM adds task duration in the diagonal elements, and replaces marks with numbers in the off-diagonal cells each representing the degree of dependency between two tasks (Browning, 1998; Yassine, 1999).
PARAMETER-BASED DESIGN MATRICES
This type of modeling is used to analyze system architecture based on parameter
interrelationships. A parameter-based DSM is constructed through explicit definition of a
system's decomposed elements and their interactions. A systematic taxonomy and a
quantification scheme assist in the analysis by categorizing types of interactions among
system elements and associating an appropriate weight to each. Table 1 and Table 2, below,
present the classification of interactions and an example of a quantification scheme
proposed by Pimmler and Eppinger (1994).
| Interaction | Description |
| Spatial | Associations of physical space and alignment; need for adjacency or orientation between two elements |
| Energy | Needs for energy transfer/exchange between two elements |
| Information | Needs for data or signal exchange between two elements |
| Material | Needs for material exchange between two elements |
| Type | Value | Description |
| Required | +2 |
Physical adjacency is required for functionality |
| Desired | +1 |
Physical adjacency is beneficial but not absolutely necessary for functionality |
| Indifferent | 0 |
Physical adjacency does not affect functionality |
| Undesired | -1 |
Physical adjacency causes negative effects but does not prevent functionality |
| Detrimental | -2 |
Physical adjacency must be prevented to achieve functionality |
Black (1990)applied a parameter-based DSM to an automobile brake system design, using the DSM to describe the current practices of a brake system component supplier. The DSM shown below is extracted from the original DSM which was (103 X 103). After sequencing the parameters, the resultant DSM (also shown below) two blocks of coupled, low level parameter determinations become apparent.
Parameter-Based DSM for Brake System (Black, 1990)
| 1 | 2 | 3 | 4 | 5 | 6 | 7 | 8 | 9 | 10 | 11 | 12 | 13 | ||
| Customer_Requirements | 1 | 1 | ||||||||||||
| Wheel Torque | 2 | 2 | X | |||||||||||
| Pedal Mech. Advantage | 3 | X | 3 | X | X | X | X | X | ||||||
| System_Level_Parameters | 4 | X | 4 | |||||||||||
| Rotor Diameter | 5 | X | X | X | X | 5 | X | X | X | X | X | |||
| ABS Modular Display | 6 | X | 6 | X | ||||||||||
| Front_Lining_Coef._of_Friction | 7 | X | X | X | 7 | X | X | X | ||||||
| Piston-Rear Size | 8 | X | X | 8 | X | |||||||||
| Caliper Compliance | 9 | X | X | 9 | X | X | ||||||||
| Piston- Front Size | 10 | X | X | X | 10 | |||||||||
| Rear Lining Coef of Friction | 11 | X | X | X | X | X | 11 | X | ||||||
| Booster-Max. Stroke | 12 | 12 | X | |||||||||||
| Booster Reaction Ratio | 13 | X | X | X | X | X | X | X | X | 13 |
Parameter-Based DSM After Sequencing (Black, 1990)
| 1 | 4 | 2 | 10 | 8 | 3 | 11 | 7 | 13 | 5 | 12 | 9 | 6 | ||
| Customer_Requirements | 1 | 1 | ||||||||||||
| System_Level_Parameters | 4 | X | 4 | |||||||||||
| Wheel Torque | 2 | X | 2 | |||||||||||
| Piston-Front Size | 10 | X | X | 10 | X | |||||||||
| Piston-Rear Size | 8 | X | X | X | 8 | |||||||||
| Pedal Mech. Advantage | 3 | X | X | X | X | 3 | X | X | ||||||
| Rear Lining Coef of Friction | 11 | X | X | X | X | 11 | X | X | ||||||
| Front_Lining_Coef._of_Friction | 7 | X | X | X | X | 7 | X | X | ||||||
| Booster Reaction Ratio | 13 | X | X | X | X | X | X | X | 13 | X | ||||
| Rotor Diameter | 5 | X | X | X | X | X | X | X | X | X | 5 | |||
| Booster-Max. Stroke | 12 | X | 12 | |||||||||||
| Caliper Compliance | 9 | X | X | X | X | 9 | ||||||||
| ABS Modular Display | 6 | X | 6 |
DSM PARTITIONING
Partitioning is the process of manipulating (i.e. reordering) the DSM rows and columns such that the new DSM arrangement does not contain any feedback marks. Thus, transforming the DSM into a lower triangular form. For complex engineering systems, it is highly unlikely that simple row and column manipulation will result in a lower triangular form. Therefore, the analyst's objective changes from eliminating the feedback marks to moving them as close as possible to the diagonal (this form of the matrix is known as block triangular). In doing so, fewer system elements will be involved in the iteration cycle resulting in a faster development process.
There are several approaches used in DSM partitioning. However, they are all similar with a difference in how do they identify cycles (loops or ciruits) of information. All partitioning algorithms proceed as follows:
PATH SEARCHING
In path searching, information flow is traced either backwards or forwards until a task is encountered twice (Sargent and Westerberg, 1964). All tasks between the first and second occurrence of the task constitute a loop of information flow. When all loops have been identified, and all tasks have been scheduled, the sequencing is complete and the matrix is in block triangular form. The figure, below, is a simple example. The path searching partition proceeds as follows:
Example
|
|
|
||||||||||||||||||||||||||||||||||||||||||||||||||||||||||||||||||||||||||||||||||||||||||||||||||||||||||||||||||||||||||||||||||||||||||||||||||||||||||||||||||||||||||||||||||||||||||||||||
|
|
|
||||||||||||||||||||||||||||||||||||||||||||||||||||||||||||||||||||||||||||||||||||||||||||||||||||||||||||||||||||||||||||||||||||||||||||||||||||||||||||||||||||||||||||||||||||||||||||||||
|
||||||||||||||||||||||||||||||||||||||||||||||||||||||||||||||||||||||||||||||||||||||||||||||||||||||||||||||||||||||||||||||||||||||||||||||||||||||||||||||||||||||||||||||||||||||||||||||||||
POWERS OF THE ADJACENCY MATRIX METHOD
Identifying Loops by Powers of the Adjacency Matrix. The Adjacency matrix is a binary DSM where an empty cell is replaced with a "zero" and a non-empty cell is replaced by one. Raising the DSM to the n-th power shows which element can be reached from itself in n steps by observing a non-zero entry for that task along the diagonal of the matrix. For example squaring the DSM (below) shows that tasks A and C are involved in a two-step loop. [Note that in the resultant square matrix, cells with a value of greater than one were replaced by a value of one].
Similarly, cubing the DSM, as shown below,
shows that tasks B, D and E are involved in a three-step loop.
The higher powers of the DSM reveal no other loops in the
system.
DSM
Square
Cube
| ||||||||||||||||||||||||||||||||||||||||||||||||||||||||||||||||||||||||||||||||||||||||||||||||||||||||||||||
Power 4
|
Power 5
|
Result
|
REACHABILITY MATRIX METHODS
DSM Partitioning Using Reachability Matrix Method. The reachability matrix is a binary DSM with the diagonal elements equal to "ONE". The method calls for finding a multi-level hierarchical decomposition for the matrix. The top level in this hierarchy is composed of all elements that require no input or are independent from all other elements in the matrix. Any two elements at the same level of the hierarchy are either not connected to each other or are part of the same circuit at that level. Once the top level set of elements is identified, the elements in the top level set and their corresponding from/to connections are removed from the matrix leaving us with a sub-matrix that has its own top level set. The top level set of this sub-matrix will be the second level set of the original matrix. Proceeding in this manner, all the levels of the matrix can be identified.
The step-by-step procedures is as follows:
Example. An excellent step-by-step example can be found in John Warfield (1973).
DSM TEARING
Tearing is the process of choosing the set of feedback marks that if removed from the matrix (and then the matrix is re-partitioned) will render the matrix lower triangular. The marks that we remove from the matrix are called "tears".
Identifying those "tears" that result in a lower triangular matrix means that we have identified the set of assumptions that need to be made in order to start design process iterations when coupled tasks are encountered in the process. Having made these assumptions, no additional estimates need to be made.
No optimal method exist for tearing, but we recommend the use of two criteria when making tearing decisions:
DSM CLUSTERING
As we have learned in the partitioning section, the goal of partitioning was to render the DSM lower triangular as much as possible. The reason was due to the significance of upper-diagonal marks, which represented feedback information flows. This situation arises whenever the matrix elements represent a set of project tasks (i.e. task-based DSM).
On the other hand, when the DSM elements represent design components (i.e. component-based DSM) or teams within a development project (i.e. team-based DSM), the goal of the matrix manipulation changes significantly form that of partitioning algorithms. The new goal becomes finding subsets of DSM elements (i.e. clusters or modules) that are mutually exclusive or minimally interacting subsets. This process is referred to as "Clustering". In other words, clusters absorb most, if not all, of the interactions (i.e. DSM marks) internally and the interactions or links between separate clusters is eliminated or at least minimized.
Example. Consider a development process that includes seven participants as shown in the DSM, below. Note that the interactions between different participants are also shown in the DSM. If we were to form several development teams within this project, what will be the number of teams required and the membership of each team?
Clustering the DSM for this project will provide us with insights into optimal team formations based on the degree of interactions among participants.
| 1 | 2 | 3 | 4 | 5 | 6 | 7 | |
| 1 | * | X | X | X | |||
| 2 | * | X | X | ||||
| 3 | X | * | X | X | |||
| 4 | X | X | * | X | X | ||
| 5 | X | * | X | ||||
| 6 | X | X | * | ||||
| 7 | X | X | X | * |
If the above DSM was rearranged in the following manner (as shown below). One possible team assignment is:
Note that by making participant 4 a member of both teams 2 and 3, we were able to absorb more interactions internally within a team.
| 1 | 6 | 5 | 4 | 2 | 3 | 7 | |
| 1 | * | X | X | X | |||
| 6 | X | * | X | ||||
| 5 | X | * | X | ||||
| 4 | X | * | X | X | X | ||
| 2 | X | * | X | ||||
| 3 | X | X | * | X | |||
| 7 | X | X | X | * |
Example. Consider the following component-based DSM for an automobile Climate Control System (Pimmler and Eppinger, 1994).
| A | B | C | D | E | F | G | H | I | J | K | L | N | M | O | P | ||
| Radiator | A | A | X | ||||||||||||||
| Engine fan | B | X | B | ||||||||||||||
| Heater Core | C | C | X | ||||||||||||||
| Heater Hoses | D | D | |||||||||||||||
| Condenser | E | X | E | X | X | ||||||||||||
| Compressor | F | X | F | X | X | ||||||||||||
| Evaporator Case | G | G | X | ||||||||||||||
| Evaporator Core | H | X | X | H | X | X | |||||||||||
| Accumulator | I | X | X | I | |||||||||||||
| Refrigeration Controls | J | J | |||||||||||||||
| Air Controls | K | K | |||||||||||||||
| Sensors | L | L | |||||||||||||||
| Command Distribution | M | M | |||||||||||||||
| Actuators | N | N | |||||||||||||||
| Blower Controls | O | O | X | ||||||||||||||
| Blower Motor | P | X | X | X | X | P |
The above DSM was rearranged such that the following module structure was apparent.
| D | J | K | L | M | N | A | B | E | F | I | H | C | P | O | G | ||
| Radiator | D | D | |||||||||||||||
| Engine fan | J | J | |||||||||||||||
| Heater Core | K | K | |||||||||||||||
| Heater Hoses | L | L | |||||||||||||||
| Condenser | M | M | |||||||||||||||
| Compressor | N | N | |||||||||||||||
| Evaporator Case | A | A | X | ||||||||||||||
| Evaporator Core | B | X | B | X | |||||||||||||
| Accumulator | E | X | E | X | X | ||||||||||||
| Refrigeration Controls | F | X | F | X | X | ||||||||||||
| Air Controls | I | X | I | X | |||||||||||||
| Sensors | H | X | X | X | H | X | |||||||||||
| Command Distribution | C | C | X | ||||||||||||||
| Actuators | P | X | X | P | X | X | |||||||||||
| Blower Controls | O | X | O | ||||||||||||||
| Blower Motor | G | X | G |
Clustering the "marks along the diagonal of the DSM resulted in the creation of three" for the Climate Control System (Pimmler and Eppinger, 1994):
DSM BANDING
Banding is the addition of alternating light and dark bands to a DSM to show independent (i.e. parallel or concurrent) activities (or system elements) (Grose, 1994). Banding is similar to partitioning the DSM using the Reachability Matrix Method when the feedback marks are ignored (a band correspond to a level).
The collection of bands or levels within a DSM constitute the critical path of the system/project. Furthermore, one element/activity within each band is the critical/bottleneck activity. Thus, fewer bands are preferred since they improve the concurrency of the system/project. For example, in the DSM shown below, tasks 4 and 5 do not depend on each other for information; therefore, they belong to the same band.
Example
| 1 | 2 | 3 | 4 | 5 | 6 | 7 | 8 | 9 | 10 | 11 | 12 | 13 | 14 | |
| 1 | ||||||||||||||
| 2 | X | X | ||||||||||||
| 3 | X | X | ||||||||||||
| 4 | X | X | ||||||||||||
| 5 | X | X | X | X | X | X | ||||||||
| 6 | X | X | ||||||||||||
| 7 | X | X | ||||||||||||
| 8 | X | X | ||||||||||||
| 9 | X | X | X | X | ||||||||||
| 10 | X | X | X | X | X | |||||||||
| 11 | X | X | X | X | ||||||||||
| 12 | X | X | X | X | X | |||||||||
| 13 | X | X | X | |||||||||||
| 14 | X | X | X | X | X | X | X | X | X | X | X | X | X |
Note that in the banding procedure, as described above, feedback marks are not considered (i.e. they are ignored in the process of determing the bands).
NUMERICAL DSM
In binary DSM notation (where the matrix is populated with "ones" "zeros" or "X" marks & empty cells) a single attribute was used to convey relationships between different system elements; namely, the "existence" attribute which signifies the existence or absence of a dependency between the different elements.
Compared to binary DSMs, Numerical DSMs (NDSM) could contain a multitude of attributes that provide more detailed information on the relationships between the different system elements. An improved description/capture of these relationships provide a better understanding of the system and allows for for the development of more complex and practical partitioning and tearing algorithms.
Example. Consider the case where task B depends on information from task A. However, if this information is predictable or have little impact on task B, then the information dependency could be eliminated. Binary DSMs lack the richness of such an argument.
What attributes/measures can be used?
| Numeric Scale | Meaning |
| 1 | High Dependency |
| 2 | Medium Dependency |
| 3 | Low Dependency |
In the above scenario, we can proceed with tearing the low dependency marks first and then the medium and high in a process similar to the level numbers method, above.
Some other attributes depend on the type of DSM used in the representation and analysis of the problem.
For example,in an Activity-based DSM, the following measures can be used:
Similar measures can be devised for other DSM types.
Note. This section of the notes was written by : Dr. T.R. Browning, Lockheed Martin TAS, Fort Worth, Texas USA. For a fuller explanation of the DSM-Sim, see Chapter 6 of Browning, Tyson Rodgers (1998) Modeling and Analyzing Cost, Schedule, and Performance in Complex System Product Development, Unpublished Ph.D. Thesis (TMP), Massachusetts Institute of Technology, Cambridge, MA.
We can use a DSM-based model of a process to quantify a process configuration’s expected cost and duration and their variances. Cost, duration (or schedule), and variances in both are largely a function of the number of iterations required in the process execution and the scope or impact of those iterations. Since iterations may or may not occur (depending on a variety of variables), this model treats iterations stochastically, with a probability of occurrence depending on the particular package of information triggering rework.
This model characterizes the design process as being composed of activities that depend on each other for information. Changes in that information cause rework. Thus, rework in one activity can cause a chain reaction through supposedly finished and in-progress activities. Activity rework is a function of the probability of a change in inputs (data package volatility and activity sensitivity) and the impact of a change in inputs (activity sensitivity). The model also assumes that independent activities can work concurrently.
As input, the DSM-Sim requires a DSM model and some additional data. For each activity, three cost and duration estimates are required: an optimistic or best case value (BCV), a most likely value (MLV), and a pessimistic or worst case value (WCV). Each activity also has an associated improvement curve, which represents learning, set up times, etc. The improvement curve is given by a percentage, the percentage of the original duration required to regenerate the outputs. (E.g., it takes 30% of the original duration to repeat the activity second and successive times.) Table 1 provides example activity data. In addition, for each activity interface, the model requires an assessment of the probability of a typical change in the data causing rework for an activity and the impact of that rework should it occur. Impact values are percentages of an activity to rework. Example probabilities and impacts are shown in the DSMs in Table 2.
Activities |
Durations (days) |
Costs ($k) |
||||||
ID# |
Name |
BCV |
MLV |
WCV |
BCV |
MLV |
WCV |
LC |
| A4 | Prepare UAV Preliminary DR&O | 1.9 |
2 |
3 |
8.6 |
9 |
13.5 |
35% |
| A511 | Create UAV Preliminary Design Configuration | 4.75 |
5 |
8.75 |
5.3 |
5.63 |
9.84 |
20% |
| A512 | Prepare & Distribute Surfaced Models & Int. Arngmt. Drawings | 2.66 |
2.8 |
4.2 |
3 |
3.15 |
4.73 |
60% |
| A531 | Perform Aerodynamics Analyses & | 9 |
10 |
12.5 |
6.8 |
7.5 |
9.38 |
33% |
| A521 | Create Initial Structural Geometry | 14.3 |
15 |
26.3 |
128 |
135 |
236 |
40% |
| A522 | Prepare Structural Geometry & Notes for FEM | 9 |
10 |
11 |
10 |
11.3 |
12.4 |
100% |
| A5341 | Develop Structural Design Conditions | 7.2 |
8 |
10 |
11 |
12 |
15 |
35% |
| A532 | Perform Weights & Inertias Analyses | 4.75 |
5 |
8.75 |
8.9< |
9.38 |
16.4 |
100% |
| A533 | Perform S&C Analyses & Evaluation | 18 |
20 |
22 |
20 |
22.5 |
24.8 |
25% |
| A5342 | Develop Balanced Freebody Diagrams External Applied Loads | 9.5 |
10 |
17.5 |
21 |
22.5 |
39.4 |
50% |
| A5343 | Establish Internal Load Distributions | 14.3 |
15 |
26.3 |
21 |
22.5 |
39.4 |
75% |
| A5344 | Evaluate Structural Strength, Stiffness, & Life | 13.5 |
15 |
18.8 |
41 |
45 |
56.3 |
30% |
| A54 | Preliminary Manufacturing Planning & Analyses | 30 |
32.5 |
36 |
214 |
232 |
257 |
28% |
| A6 | Prepare UAV Proposal | 4.5 |
5 |
6.25 |
20 |
22.5 |
28.1 |
70% |
Table 1: Activity Data for Model Input
1 |
2 |
3 |
4 |
5 |
6 |
7 |
8 |
9 |
10 |
11 |
12 |
13 |
14 |
|||
| A4 | Prepare UAV Preliminary DR&O | 1 |
||||||||||||||
| A511 | Create UAV Preliminary Design Configuration | 2 |
.4 |
.2 |
||||||||||||
| A512 | Prepare & Distribute Surfaced Models & Int. Arngmt. Drawings | 3 |
.5 |
.4 |
||||||||||||
| A531 | Perform Aerodynamics Analyses & Evaluation | 4 |
.3 |
.5 |
||||||||||||
| A521 | Create Initial Structural Geometry | 5 |
.4 |
.5 |
.1 |
.1 |
.3 |
.1 |
||||||||
| A522 | Prepare Structural Geometry & Notes for FEM | 6 |
.1 |
.4 |
||||||||||||
| A5341 | Develop Structural Design Conditions | 7 |
.4 |
.4 |
||||||||||||
| A532 | Perform Weights & Inertias Analyses | 8 |
.5 |
.5 |
||||||||||||
| A533 | Perform S&C Analyses & Evaluation | 9 |
.4 |
.5 |
.5 |
.5 |
||||||||||
| A5342 | Develop Balanced Freebody Diagrams & Ext. Applied Loads | 10 |
.1 |
.5 |
.2 |
.1 |
.4 |
|||||||||
| A5343 | Establish Internal Load Distributions | 11 |
.5 |
.5 |
.5 |
.5 |
||||||||||
| A5344 | Evaluate Structural Strength, Stiffness, & Life | 12 |
.4 |
.4 |
.5 |
.5 |
.4 |
|||||||||
| A54 | Preliminary Manufacturing Planning & Analyses | 13 |
.5 |
.5 |
.4 |
|||||||||||
| A6 | Prepare UAV Proposal | 14 |
.3 |
.4 |
.4 |
.4 |
.4 |
.4 |
.4 |
.4 |
.4 |
.4 |
.4 |
.4 |
.4 |
1 |
2 |
3 |
4 |
5 |
6 |
7 |
8 |
9 |
10 |
11 |
12 |
13 |
14 |
|||
| A4 | Prepare UAV Preliminary DR&O | 1 |
||||||||||||||
| A511 | Create UAV Preliminary Design Configuration | 2 |
.5 |
.1 |
||||||||||||
| A512 | Prepare & Distribute Surfaced Models & Int. Arngmt. Drawings | 3 |
.3 |
.5 |
||||||||||||
| A521 | Create Initial Structural Geometry | 4 |
.4 |
.8 |
||||||||||||
| A522 | Prepare Structural Geometry & Notes for FEM | 5 |
.1 |
.1 |
.1 |
.3 |
.1 |
|||||||||
| A531 | Perform Aerodynamics Analyses & Evaluation | 6 |
.1 |
.3 |
||||||||||||
| A532 | Perform Weights & Inertias Analyses | 7 |
.5 |
.8 |
||||||||||||
| A533 | Perform S&C Analyses & Evaluation | 8 |
.5 |
.5 |
||||||||||||
| A5341 | Develop Structural Design Conditions | 9 |
.3 |
.3 |
.3 |
.3 |
||||||||||
| A5342 | Develop Balanced Freebody Diagrams & Ext. Applied Loads | 10 |
.1 |
.5 |
.4 |
.3 |
.3 |
|||||||||
| A5343 | Establish Internal Load Distributions | 11 |
.5 |
.5 |
.3 |
.3 |
||||||||||
| A5344 | Evaluate Structural Strength, Stiffness, & Life | 12 |
.5 |
.3 |
.5 |
.5 |
.5 |
|||||||||
| A54 | Preliminary Manufacturing Planning & Analyses | 13 |
.9 |
.9 |
.3 |
|||||||||||
| A6 | Prepare UAV Proposal | 14 |
.5 |
.8 |
.8 |
.8 |
.8 |
.8 |
.8 |
.8 |
.8 |
.8 |
.8 |
.8 |
.8 |
Table 2: DSM Dimensions One (Top) and Two, Showing Rework Probabilities and Rework Impacts, Respectively
Points to note on the simulation formulation are as follows:
The simulation is implemented in a spreadsheet. Table 3 presents the important variables used in the model, and Table 4 provides an overview of the algorithm.
| r | number of runs in the simulation |
| n | number of activities in the process |
| C | Cumulative process cost for a given run |
| S | Cumulative process duration for a given run |
| ?t | time step size in simulation |
| tx | the current time step |
| ActSn | activity duration vector: a vector of length n containing a duration value for each activity, sampled from each activity’s PDF of possible duration outcomes |
| ActCn | activity cost vector: a vector of length n containing a cost value for each activity, sampled from each activity’s PDF of possible cost outcomes |
| Wn | work vector: a vector of length n with a [0,1] entry for each activity, indicating work to be done on that activity; initially set to all "1"s to indicate 100% of the work remains for each activity |
| Winitn | initial values for the W vector for each run |
| WNn | "work now" vector: a vector of length n with a Boolean entry for each activity, indicating the need to work on the activity during the current time step |
| LCn | "learning curve" vector: a vector of length n with a percentage entry for each activity, indicating the percentage of the original activity duration required for second and successive executions of the activity |
| DSMnnk | DSM
(off-diagonal of n x n matrix with third dimension k): dimension k = 1: rework probability [0,1] for superdiagonal entries where i < j, the probability of activity j causing rework for activity i; for subdiagonal entries where i > j, the probability of activity j causing second-order rework for interim activity i after an iteration of activity j dimension k = 2: rework impact [0,1] the added work (in terms of the impact on the work vector, W) should iteration or second-order rework occur |
Table 3: Model Variables
| 1. Set W vector to Winit values. |
| 2. Sample activity costs and durations from their distributions. |
| 3. Convert duration to time steps, rounding off (minimum duration is one time step). |
| 4. Each time step: Set all WN = FALSE. Find first activity, i, that has unfinished work—i.e., where W(i) > 0. Set WN(i) = TRUE. Loop through subsequent activities to identify concurrent work for the current time step. If next activity has unfinished work and is not dependent on an unfinished, upstream activity, then set its WN entry to TRUE. Otherwise, the complete band has been found (stop checking activities). Loop through all activities: If activity doing work this time step—i.e., if WN(i) = TRUE—then: Subtract appropriate fraction of the work from W(i) for each working activity. If W(i) < 0.01 then W(i) = 0 to prevent rounding errors from prolonging activity duration. Add appropriate fraction of each working activity’s cost to cumulative cost, C. If activity doing work this time step and just finished—i.e., if WN(i) = TRUE and W(i) = 0—then: Look through column in DSM immediately above newly finished activity for potential iterations. Evaluate each possibility versus a random number; if required, then: Add appropriate rework (given in DSM dimension two, and adjusted for learning curve benefits) to W vector entry for affected, upstream activity. But if W vector entry is now greater than one (because activity was not finished), reduce it to 0.9 to keep work from expanding beyond original scope and to represent some learning.
Look through column in DSM immediately below upstream activity for potential
second-order If any activity has more work to do, then increment time step and repeat; otherwise, finish run. |
| 5. Convert number of time steps back into time units to determine S. |
| 6. Save C and S with run number. |
Table 4: Algorithm for Each Run of Model
Points to note are as follows:
SIMULATING DSMs BASED ON INFORMATION AND RESOURCE CONSTRAINTS
Introduction.
DSM literature focuses on a single projects, where precedence information constraints determine the execution sequence for the activities and the resultant project lead-time. In this research, we consider a DSM model for multiple projects that share a common set of design resources. Especially in this setting, precedence information availability is insufficient to assure that activities will execute on time. We extend the DSM modeling literature by including resource availability, where activity execution is based on both information and resource constraints.
The Multi-Project DSM Model.
Here we discuss the extension of the single-project DSM to include multiple projects and resource constraints. We refer to the multi-project DSM as the aggregate DSM.Building the aggregate DSM is best illustrated through a simple example. Consider three development projects occurring simultaneously (projects 1, 2, and 3) and involving four development resources/processors (A, B, C, and D), as shown in the top part of Figure 1. Processor A is assigned to all projects as depicted in the Figure by A1, A2, and A3.Processor B is assigned to projects 1 and 2 as depicted in the Figure by B1 and B2.The same representation holds for processors C and D.
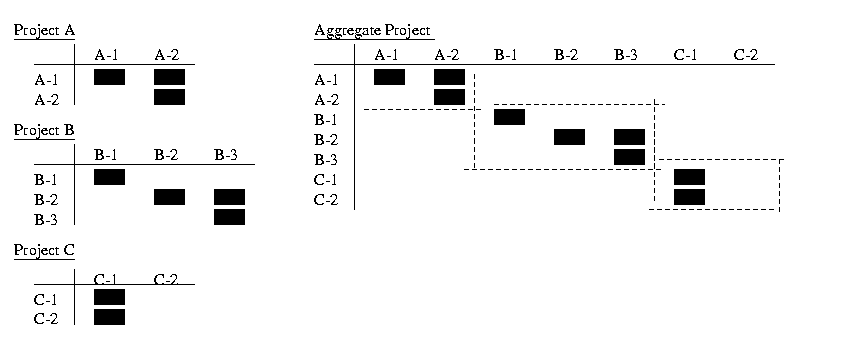
The aggregate DSM, shown in the lower part of Figure 1,
combines the DSMs for each project.
The square marks (“n”)
inside the aggregate DSM represent information constraints, while the diamond
marks (“v”) represent resource
constraints. Note that the diamond marks shown in the figure represent
only one possible resource constraint profile. The arrangement shown assumes
that activities in project 1 are preferred to activities in project 2,
and activities in project 2 are preferred to activities in project 3.For
example, the diamond mark in row 5 and column 1 conveys that A2 depends
on A1 finish for its execution. Inserting this mark in row 1 column 5,
instead, would reverse the resource dependency. In general, if a processor
is assigned to p projects, then there are (p!) possible priority
profiles for that processor.
The aggregate DSM provides managers of multiple
projects a simple snapshot of the whole development portfolio, allowing
them to clearly see and trace information dependencies within projects
and across multiple projects, while explicitly accounting for resource
contention.[1]
Partitioning the aggregate DSM reveals an improved information flow and
clear resource prioritization across the whole PD portfolio as compared
to independently partitioning the individual project DSMs.
Project Queues
Each processor can be involved in multiple activities (from the same or different projects), but they can only work on one project's activity at any given moment. The list of activities from different projects is called the project queue for a processor. We will refer to each processor's project queue as Qi, where i is the processor index.
At any time,
t,
Qi(t)
consists of two mutually exclusive and collectively exhaustive partitions:
Ai(t)
and Ii(t).
The processor's active queue,
Ai(t),
contains a subset of Qi(t) that is readily available
for work (based on predecessor information availability only) at time t.
The processor must choose one of these activities to work on. The inactive
queue, Ii(t), contains all other activities. Coupled
activities are those activities involved in an iterative block. A
work policy is used to allocate coupled activities to either Ai(t)
or Ii(t) based on how the activities are sequenced in
the DSM (the process architecture determined by partitioning). The first
activities in the coupled block make assumptions about the later activities’
inputs and are assigned to Ai(t).
The Preference Function
If a processor is assigned to two projects and
it can perform work on either one, at a given instant in time, the choice
is made based on a preference function that includes activity, project,
and processor characteristics. The preference function addresses the
following concerns:
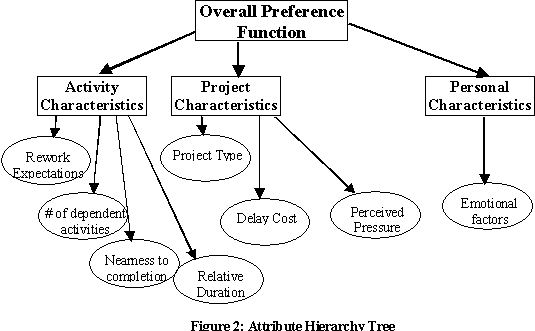
The preference function (or priority profile) ranks the activities in processors’ active queues, so that the activity with the highest priority is selected to work on. Preference or priority is a function of activity, project, and processor attributes. The attribute hierarchy is shown in the tree of Figure 2.Determining how to weight the attributes requires conducting interviews with the processors involved in the different projects to solicit their mental value model they use when determining activity priorities. The preference function consists of a weighted combination of the eight attributes listed and discussed in Table 1.
Each branch, i, in the attribute hierarchy Figure 2) has a weight, ki, and a utility or preference value, Ui, which is a function of the attribute level, xi.
To arrive at an overall preference index for each activity, we can use a weighted sum: U(x1, …., xn) =
Each utility curve is defined over [0,1], and all of the weights are positive and sum to one, so the overall preference index is also defined over [0,1]. Once a preference index is calculated for each activity in a processor’s active queue, the activity with the highest preference index is preferred.
| Activity Attributes | 1. Expectations for activity rework (Rework Risk). People’s choice of whether or not to work on an activity can be influenced by their knowledge of the likelihood of that activity to change or be reworked later. Prior to running the simulation, a “rework risk” is estimated for each activity based on the likelihood and the impact of changes in the activity’s inputs. The estimate combines the impacts of both first- and second-order rework. First-order rework is caused by changes in inputs from downstream activities and is the sum of the product of rework probability and rework impact for all such inputs. Second-order rework is caused by changes in inputs from upstream activities which themselves have some risk of first-order rework. Second-order rework is the sum of the product of rework probability and rework impact for all such inputs, where each such product is further multiplied by the upstream activity’s estimated rework risk. |
| 2. Number of dependent activities. People are more likely to work on activities upon which a large number of other people depend. The number of marks in each column of the binary DSM is counted to determine the number of dependent activities. | |
| 3. Nearness to completion. This attribute is a function of the amount of work remaining for the activity. It assumes that people would rather finish nearly complete activities than begin new activities. (The attribute can also be set to reflect the reverse situation). | |
| 4. Relative duration. This attribute assumes that shorter activities will be preferred to longer ones. Prior to running the simulation (but after a random sample has been obtained for each activity’s duration), the relative duration of each processor’s activities is determined. Each processor’s activities are classified as either the shortest or the longest duration activity for that processor, or else in-between. (This attribute can also be set to prefer longer activities.) | |
| Project Attributes | 5. Cost of project delay. A cost of delay is supplied for each project as an input to the simulation. Activities in projects with higher costs of delay are given greater priority. |
| 6. Project type. Project type is also given for each project as an input to the simulation. We classify project type based on project visibility and/or priority—which is either “high,” “medium/normal,” or “low.” | |
| 7. Schedule pressure. As a project falls behind schedule, pressure builds to finish its activities. Each project and each activity within it have scheduled completion times or deadlines, which are provided as inputs to the simulation. Project schedule pressure is the sum of the schedule pressure contributions of all of its activities. | |
| Processor Attribute | 8. Personal and interpersonal factors. It is impossible to represent the comprehensive set of factors that influence a processor’s choice of projects and activities. Therefore, we utilize a random factor to represent other influences, including personal and interpersonal (and even irrational) factors. The random factor can represent personality, risk propensity or averseness, interpersonal relationships—really anything not attributable to the other attributes. |
Table 1: The Eight Attributes Used in Developing the Preference Function
Simulating the Model
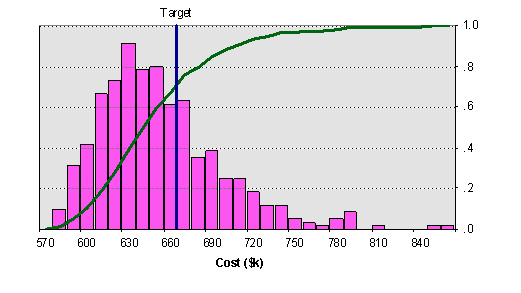
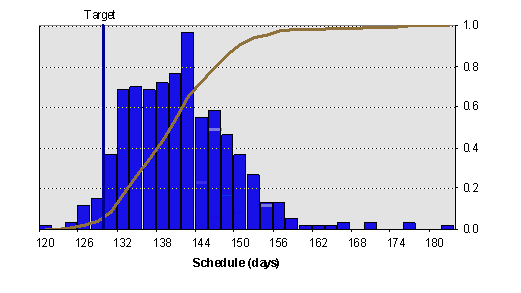
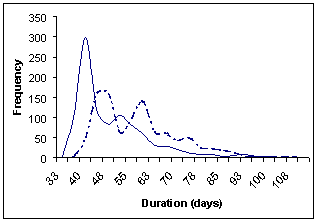
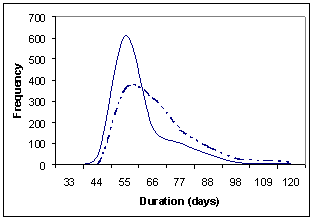
The simulation is implemented in a spreadsheet model using Excel Visual Basic macro programming (click here to download). All input information (i.e. project data and the corresponding activity details) is entered into the Excel spreadsheet. Then, the simulation starts by executing the simulation macros. The results of the simulation are displayed as a set of lead-time distributions for each project and for the whole portfolio as shown in Figure 3.
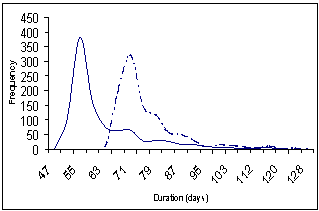
(a) Lead time distributions for the overall project portfolio: with and without resource constraints |
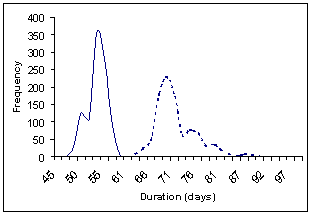
(b) Lead time distributions for Project 1: with and without resource constraints |
(c) Lead time distributions for Project 2 |
(d) Lead time distributions for Project 3 |
In our simulation, project execution is guided by a specific work policy.
Insert material soon .....
REFERENCES
WEB RESOURCES
Developed in April 2001 by Mark Austin
Copyright © 2001-2002, Mark Austin, University of Maryland