
Figure 1. Schematic of a minefield that has been breached, but isn't marked.
Student: Adrian Marsh
Faculty Advisors: John Baras and Mark Austin.
Date: September 2002 -- May 2003.
TABLE OF CONTENTS
Scope and Objectives
The purpose of this project is to design a system, mountable to existing and future military combat vehicles, that will mark a lane through a minefield without exposing soldiers to direct and indirect fire.
In the first half of this study, initial high-abstraction requirements are determined. From these requirements the system is modeled through the use of use-case scenarios to refine requirements. From the refined requirements high-level system structure and behavior diagrams were constructed to represent the system.
The second half of this report focuses in on the detailed design and trade-off analysis of the "hand control unit." We refine the initial requirements, turn the requirements into specifications, and conduct a trade-off analysis to optimize components of the system design.
The Problem
Currently there is no mechanical means of marking a breach lane through an enemy minefield.
Figure 1 shows the situation where a minefield has been breached, but isn't marked.
Figure 1. Schematic of a minefield that has been breached, but isn't marked.
To avoid soldier casualties due to mine strike, we need a mechanism for marking the breach lane through a minefield. Presently, this marking process is entirely manual.
Discussion. The lack of such a system forces soldiers to exit their combat vehicle to mark a breach lane causing the following:
Furthermore, failure to effectively mark a breach lane greatly increases the likely-hood of follow on forces to run into the minefield and additional, unnecessary casualties.
The Solution
Develop a combat marking system, deployable from within a vehicle, which will successfully mark a breach lane.
The proposed marking system will allow breaching and marking to occur simultaneously, without soldier exposure to direct fire. See Figure 2.

Figure 2. Schematic of the Combat Marking System
Figure 3 shows operation after the breached lane has been marked.
Figure 3. Operation of the breached marking lane.
Components in the Combat Marking System
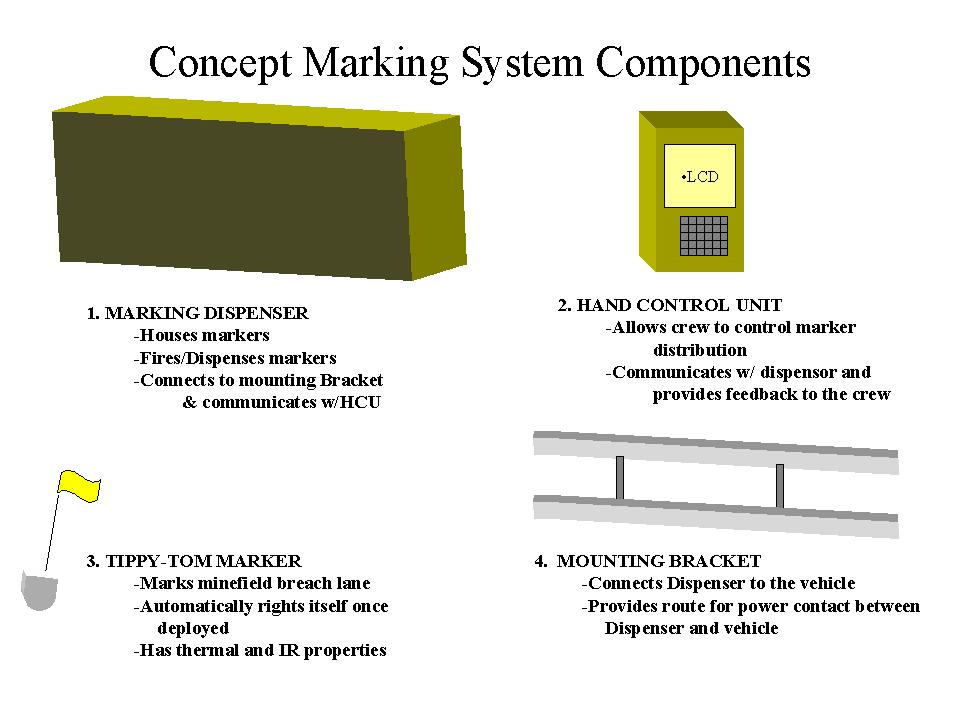
Figure 4. Components in the Combat Marking System
Field Examples
The adjacent diagram shows combat engineers marking a breach lane at the Combined Maneuver Training Center,
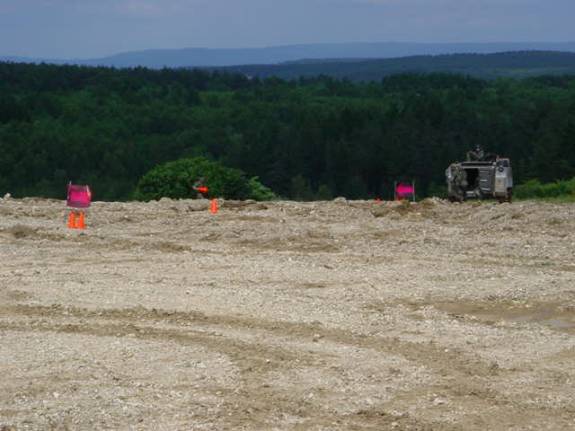
Figure 5. Field Implementation of the Breach Lane Markup
Initial Requirements: Brief
Brief list of initial planning requirements used to guide goal and scenario development and determine system optimization.
Project Framework and Focus
The overall program responsibilities from a high level of abstraction are depicted in the following Use Case diagram.
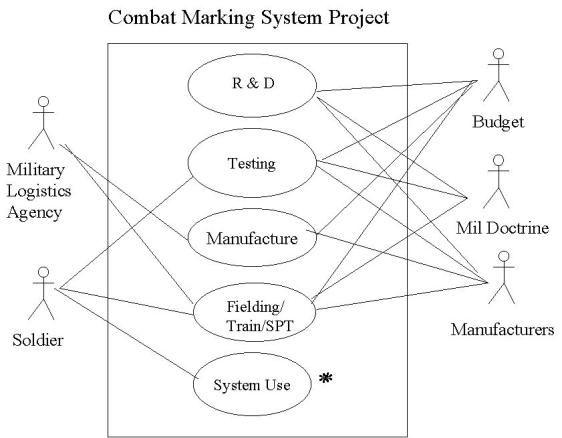
Figure 6. High-Level Abstraction for the CMS Program
The remainder of this case study will focus on the "System Use" aspect of this diagram to focus on the system design rather than life-of development and fielding cycle.
Goals and Scenarios
Goal 1. System is mountable on variety of equipment
Goal 2. System marks minefield lane
Goal 3. System must withstand combat conditions
Goal 4. Marking system must be visible to friendly personnel
Goal 5. Fielding must include support package (High-level abstraction requirement)
System Actors and Roles
| |
|
| Crew (2 personnel) | Mounts and operates the marking system. |
| Follow on force | Vehicles and crews that follow the breach marking team through the breach lane. Must be able to observe the marking material and uses it to navigate through the obstacle. |
| Vehicle | The piece of equipment that has the system mounted on it for use. |
| Environment | Provides operational conditions for marking system. |
| Combat Effects | Enemy indirect or direct fire to destroy the system or the marking. |
Table 1. Actors and Roles
System Boundary
In this initial design the System Boundary is defined as the dispenser, control unit, mount and markers. In future designs these would be broken down again focusing on each and using the related components as actors for further clarification of requirements and system development.
Initial Use Case Diagram
Initial USE CASE diagram for the Combat Marking System depicts the actors and their interaction with the systems.
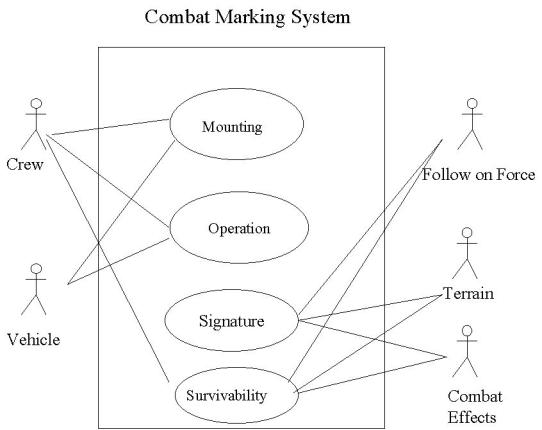
Figure 7. Initial Use Case Diagram for the CMS System
Use Case Text and Activity Diagrams
Use Case 1. Mounting Bracket
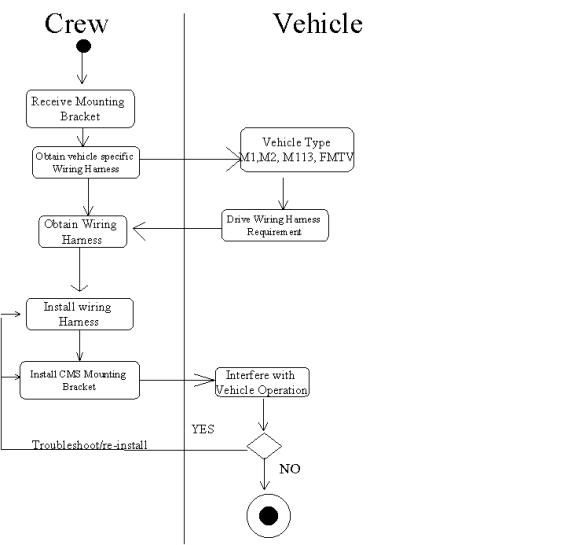
Figure 8. Activity Diagram for Mounting and Installation
Use Case 2. Mounting
Use Case 3. Crew prepares CMS for operation
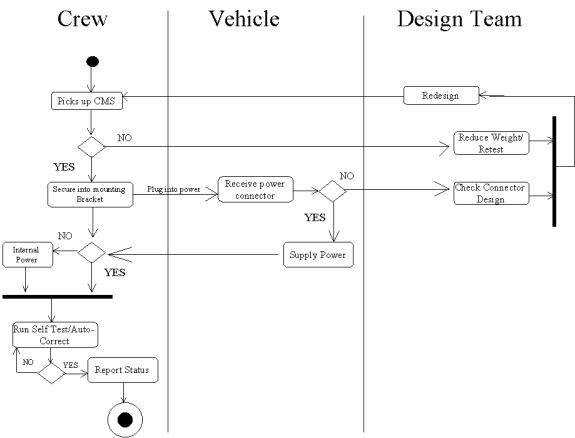
Figure 9. Activity Diagram for Mounting and Preparing for Operation
Use Case 4. Loading
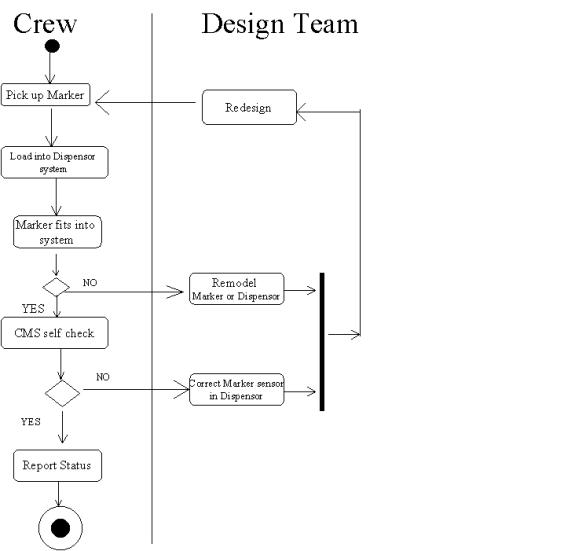
Figure 10. Activity Diagram for Loading Dispenser
Use Case 5. Marking lane
Use Case 6. CMS survivable
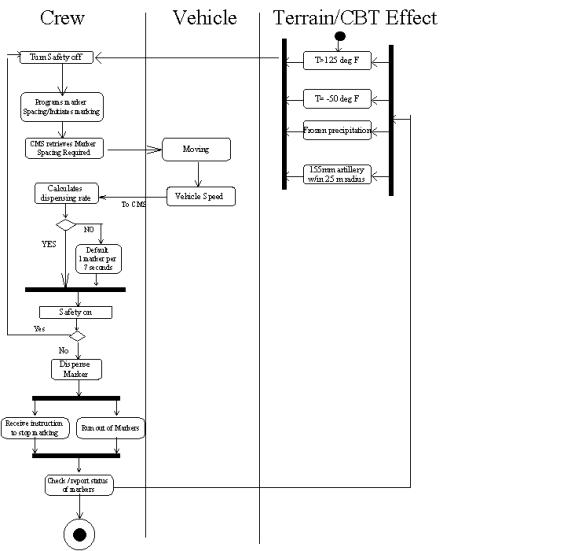
Figure 11. Activity Diagram for Lane Marking and CMS Survivability (Use Cases 5-6)
Use Case 7. Marking system is visible
Use Case 8. Marking system is survivable/visible
Temporal Relationship Among Use Cases
The adjacent figure shows the use cases organized temporally -- first we mount the marking system, then we prepare for operation ... and so forth.
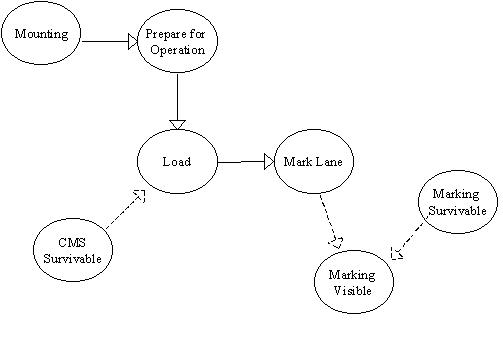
Figure 12. Temporal Relationship Among Use Cases
Use Case to Requirements Traceability
The following chart identifies the requirements and the Use Cases that each requirement is associated with. Additionally, it depicts the scenario number and requirement number. The requirement number will be used in additional diagrams to depict the location or function that achieves each requirement.
| |
|
|
|
| Mounting Bracket | |
|
Universal Mounting Bracket |
| |
|
Vehicle Specific Wiring Harness to tie into vehicle power source. | |
| |
|
Must attach to CMS dispenser | |
| System Mounting | |
|
CMS system less than 100lbs (empty) |
| |
|
Does not interfere with vehicle operation | |
| Prepare for Operation | |
|
Must have mechanism for communicating with the crew inside the vehicle. |
| |
|
CMS system has internal power source | |
| |
|
CMS system is capable of performing internal function check and passing this information to crew | |
| Loading | |
|
CMS system interfaces/senses presence of markers |
| |
|
System provides feedback on status of markers to operators. | |
| |
|
System is able to reload markers. | |
| Marking Lane | |
|
System fires/dispenses markers |
| |
|
System defaults at 10 m interval spacing. | |
| |
|
Crew can select marking interval | |
| |
|
System safety feature to prevent unwanted deployment. | |
| CMS Survivable | |
|
CMS withstands heat > 150 deg F |
| |
|
CMS withstands cold < 100 deg F | |
| |
|
System has built in heat/thaw function to remove frozen water/snow. | |
| |
|
System is water proof. | |
| |
|
System withstands a 155mm artillery strike within 25 M. | |
| Marking System Visibility | |
|
Marking system upgrade to add GPS signaling device. |
| Marking System Survivable | |
|
System at least 3 ft tall when deployed. |
| |
|
Markers weather resistant. | |
| |
|
Sends IR signal. | |
| |
|
Sends Thermal signal | |
| |
|
Durable enough to withstand a 155 mm artillery strike within 25m. |
Table 2. Traceability of Use Cases to Requirements
System Structure
The system structure of the Combat Breaching system is depicted in the class diagram below.
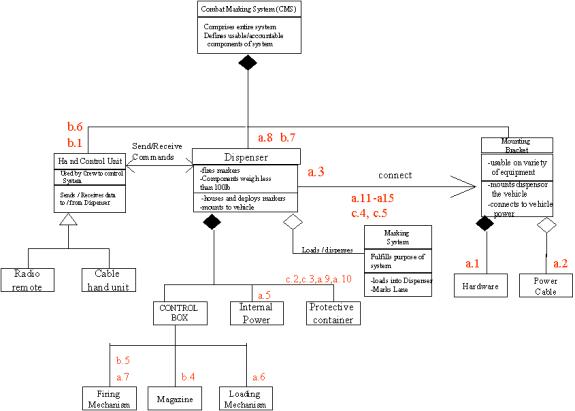
Figure 13. Class Diagram depicting System Structure
Of note this diagram depicts two choices for the hand control unit either the cable unit or the radio remote unit. Additionally, the requirements in chart 2 are depicted on the diagram in red, to assist in the traceability of the requirements.
Objects and Attributes
| |
|
|
| Bracket Hardware |
Strength Weight less than 100lbs Mechanical locking devise to secure Dispenser |
Bolts/Weld |
| Bracket Power Cable | Vehicle specific design | Cable |
| Control Box |
Shockproof construction Waterproof Expansion ports |
Cable in Dispenser FM or Cable to Hand Control Unit |
| Dispenser |
Weight less than 100 lbs. Attach to Bracket Hardware Houses Firing Mechanism, Loading Mechanism and Magazine |
Locking Mechanism Cables |
| Firing Mechanism |
Fires at a minimum rate of 1 Marker per 5 seconds Jam rate less than 1/1000 attempts |
Bolt/Weld Cables |
| Hand Control Unit |
Hardwire or FM optional LCD display Switch to control marker spacing 5m, 10m, 15m, 20m Contains safety switch |
FM or CABLE |
| Internal Power | Re-chargeable internal battery | Cable |
| Loading Mechanism | Cycles markers at a rate of 1/5 sec | Bolt/Weld/Cable |
| Magazine | Holds at a min of 20 markers | Locking Device/Bolt |
| Marking System |
Min 3ft tall once deployed
IR signature Thermal Signature Space for GPS expansion Visual signature Self standing |
|
| Protective Container |
Waterproof Heater mechanism included Withstand 155mm artillery shell w/in 25 m |
Bolt/Weld Gaskets |
Table 3. Objects and Attributes of the System
System Behavior
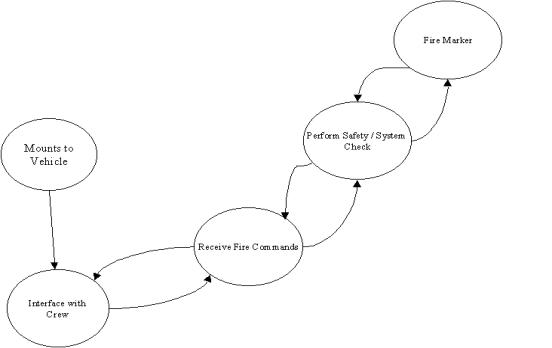
Figure 14. Finite State Machine for Combat Marking System Behavior
The simplified diagram above depicts the system behavior at a high level of abstraction. An additional look of the system is in
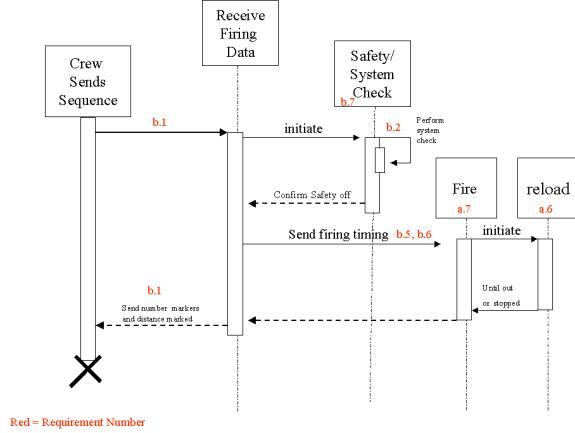
Figure 15. Sequence Diagram depicting System Firing Behavior
Again the red letter-number combination shows the requirements in the system and how they trace through system behavior. The model above depicts the behavior of the system during the firing sequence.
PERFORMANCE ATTRIBUTES
| |
|
| Mounting |
|
| Prepare for Operation |
|
| Firing |
|
| Loading |
|
| Marking |
|
Table 4. Performance Attributes for system behavior
Mapping System Behavior onto the System Structure
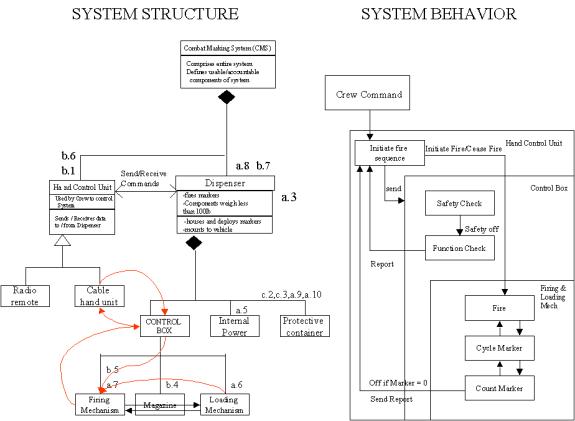
Figure 16. System Behavior Mapped onto System Structure for Firing System
The red arrows and lines indicate the mapping of the system behavior onto the system structure.
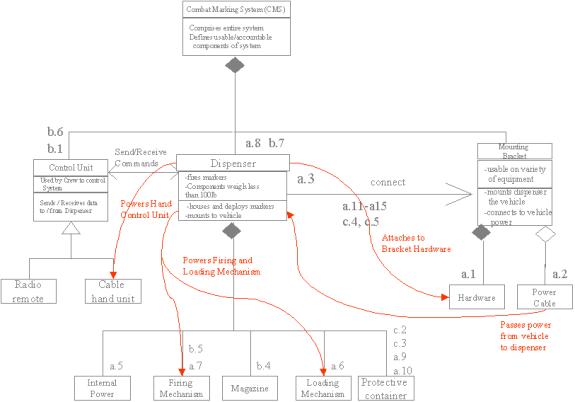
Figure 17. Power Behavior Mapped onto System Structure
Use Case to Component Traceability
| |
|
|
|
|
| Mounting Bracket | 1.1 | a.1 | Universal Mounting Bracket | Bracket |
| 3.1 | a.2 | Vehicle Specific Wiring Harness to tie into vehicle power source | Mounting Bracket | |
| 1.1 | a.3 | Must attach to CMS dispenser |
Protective Container |
|
| System Mounting | 1.2 | a.4 | CMS system less than 100lbs (empty) |
Dispenser |
| 1.3 | c.1 | Does not interfere with vehicle operation. | Protective Container |
|
| Prepare for operation |
2.1 | b.1 | Must have mechanism for communicating with the crew inside the vehicle. | Hand Control Unit |
| 3.1 | a.5 | CMS system has internal power source. | Internal Power | |
| 2.1 | b.2 | CMS system is capable of performing internal function check and passing this information to crew | Control Box | |
| Loading | 2.2 | b.3 | CMS system interfaces/senses presence of markers. | Magazine |
| 2.1 | b.4 | System provides feedback on status of markers to operators. | Control Box | |
| 2.2 | a.6 | System is able to reload markers. | Loading Mech | |
| Marking Lane | 2.2 | a.7 | System fires/dispenses markers | Firing Mech |
| 2.3 | b.5 | System defaults at 10 m interval spacing. | Control Box | |
| A.1 | b.6 | Crew can select marking interval | Control Box | |
| A.2 | b.7 | System safety feature to prevent unwanted deployment. | Control Box | |
| CMS Survivable | 3.2.A | c.2 | CMS withstands heat > 150 deg F | Protective Container |
| 3.2.C | c.3 | CMS withstands cold < 100 deg F | Protective Container |
|
| 3.2.C | a.8 | System has built in heat/thaw function to remove frozen water/snow. | Protective Container |
|
| 3.2.B | a.9 | System is water proof. | Protective Container |
|
| 3.3 | a.10 | System withstands a 155 mm artillery strike within 25 M | Protective Container |
|
| Marking System Visibility | 2.1 | a.11 | Marking system upgradeable to add GPS signaling device. | Marking System |
| Marking system survivable | 4.0 | a.12 | System at least 3 ft tall when deployed | Marking System |
| 3.2 | c.4 | Markers weather resistant | Marking System | |
| 4.1.A | a.13 | Sends IR signal | Marking System | |
| 4.1.B | a.14 | Sends Thermal signal | Marking System | |
| 3.2 | c.5 | Durable enough to withstand a 155mm artillery strike within 25m |
Protective Container |
Table 5. Use Case Component Interaction Matrix
Table 5 traces the use case and requirements to the sub-component that will meet the requirement.
The remainder of this report deals exclusively with design of the Hand Control Unit (HCU). We will detail the process of selecting commercially made components to meet the project specifications.
Refining System Requirements
Close examination of the requirements identified in ENSE 621 demonstrated a need for refinement. The initial requirements outlined were based on a high level abstraction and were not suitable for component level design. Additionally, the initial requirements did not include Attributes and Functions in the requirement list, which are essential to determining component design. Finally, the initial requirement numbering system needed to be updated to facilitate refined traceability needs.
The initial requirements were updated in the subsequent design of the system. Attributes and Functions were assigned to each object in the requirements list, additional requirements were added to support a lower level of abstraction, and the requirement numbering system was updated.
Refining the System Structure
The initial system structure diagram was at a high level of abstraction and did not sufficiently include Attributes and Functions needed for design. The updated class diagram (see Figure 18 below) includes additional components and the Attributes and Functions derived from the new requirements.
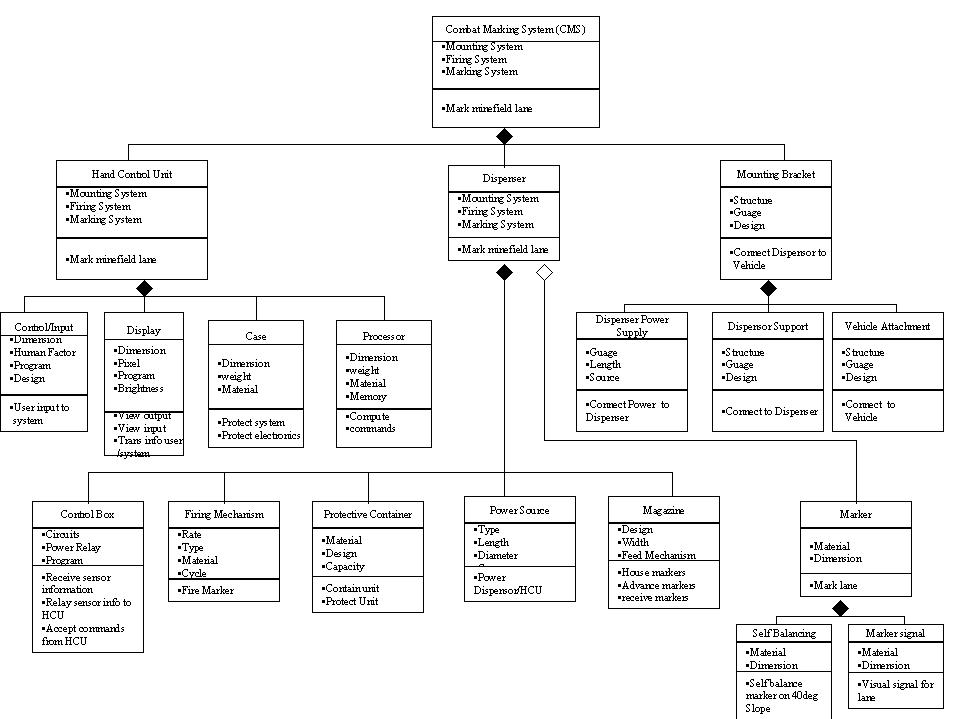
Figure 18. Updated Combat Marking System Structure
Focusing on the HCU, the class diagram is modified to present the components of interest: the LCD display, the keyboard and the processing unit. See Figure 19.
Figure 19. Hand Control Unit System Structure
Additionally, the subsystem behavior is used in examining the hand control unit in detail.
System Behavior
For the "hand control unit" design, we assume that the system-level behavior diagram is adequate.
Figure 20 depicts the behavior of the selected system in conducting a systems functions check. This will assist us in optimizing the sub-component interaction.
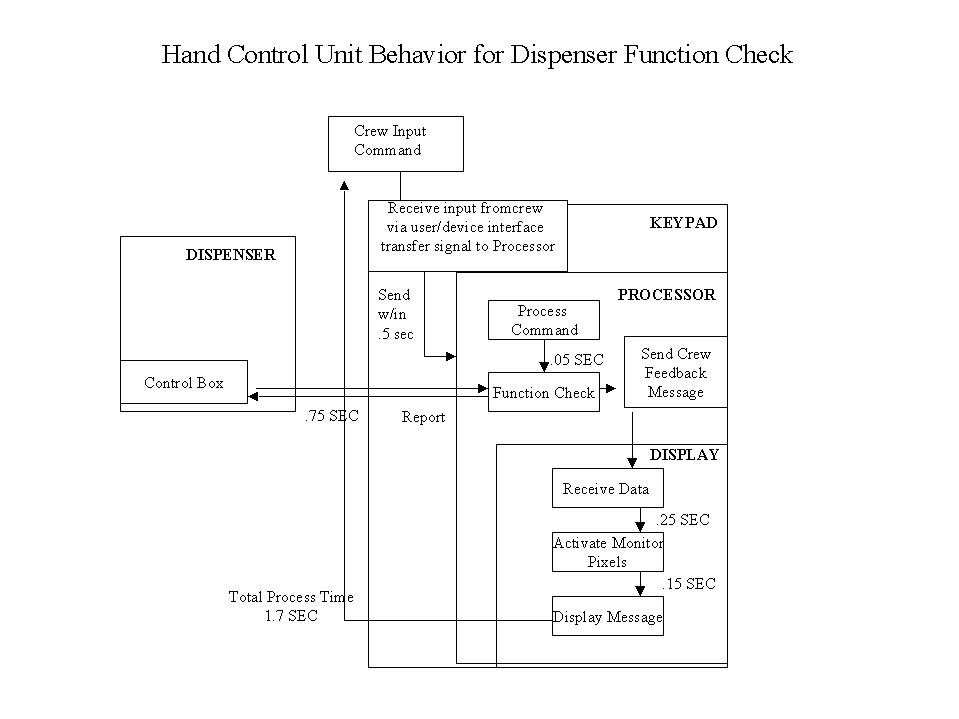
Figure 20. Hand Control Unit System Behavior Diagram (for system's function check)
Hand Control Unit Requirements
| |
|
|
|
|
|
| |
|
||||
| |
|
The system must have mechanism for communicating with the crew inside the vehicle. | |
|
|
| |
|
The dispenser shall fire within 1 second of receiving firing commands from the crew. | |
|
|
| |
|
The CMS system shall perform internal function check and pass this information to the crew. | |
|
|
| |
|
The system shall check safety prior to firing within one second of receiving firing command. | |
|
|
| |
|
The system shall conduct a function check within 1 min and pass information to crew. | |
|
|
| |
|
The dispenser shall display information to crew. | |
|
|
| |
|
The system shall receive commands from crew and send to dispenser. | |
|
|
| |
|
The crew shall be able to send signals to the dispenser. | |
|
|
Table 6. Hand Control Unit Requirements
Turning System Requirements into System Specifications
Once the system requirements were refined, system specifications were needed to set limits on the component design. The system specifications were comprised from the Attributes and Functions outlined in the system requirements. These govern the formulation of specifications by stating what the component must do (Functions) and also what characteristics they must have (Attributes).
The system specifications for this project were largely determined from analysis of similar systems already in existence.
Component Specifications for LCD
Flowdown from Scenarios and Requirements
Specifications
| |
|
|||
| |
|
|
|
|
| Control Unit Display |
|
(uses) |
|
|
| |
|
|
|
|
| |
|
|
|
|
| |
|
|
|
|
| |
|
|
|
|
| |
Height (mrad) = |
|
|
|
Table 7. Specifications for LCD
Component Specifications for CPU
Specifications
| |
|
|||
| |
|
|
|
|
| Control Processor |
|
(uses) |
|
|
| |
|
|
|
|
| |
|
|
|
|
| |
|
|
|
|
| |
|
|
|
|
Table 8. Specifications for CPU
Component Specifications for Keypad
Specifications
| |
|
|||
| |
|
|
|
|
| Control Unit Input |
|
(uses) |
|
|
| |
|
|
|
|
| |
|
|
|
|
| |
|
|
|
|
| |
|
|
|
|
Table 9. Specifications for LCD
Turning Specifications for HCU into Commercial Component Options
The HCU SPEC sheet quantifies the Attributes and Functions in the Requirement listing, and is used to determine commercially available products to comprise the HCU, display, keyboard and processor.
A search of vendor websites provided numerous component options to meet the needs of the Hand Control Unit (see Table 10). In order to optimize the system a Trade-Off Analysis is required to determine the proper mix of components.
| |
|
||
| |
PX20 |
AP9215 |
QVGA-0076 |
| |
Multiproc |
PCI 64/66 |
FP32C |
| |
INC |
AX-50 |
SYS Z21 |
Table 10. Commercial Options for HCU Sub-Components
Design Alternatives for LCD
| |
|
|
|||
| |
|
|
|
|
|
| Component Life | |
|
|
|
|
| Weight (g) = | |
|
|
|
|
| Cost/Unit ($) = | |
|
|
|
|
| Screen Area (sq in = | |
|
|
|
|
| Power Usage (W) = | |
|
|
|
|
| Height (cm) = | |
|
|
|
|
Table 11. Specifications for Commercial LCD Options
Design Alternatives for CPU
| |
|
|
|||
| |
|
|
|
|
|
| Component Life | |
|
|
|
|
| Weight (g) = | |
|
|
|
|
| Cost ($) = | |
|
|
|
|
| Memory (Mb) = | |
|
|
|
|
| Power Usage (W) = | |
|
|
|
|
Table 12. Specifications for Commercial CPU Options
Design Alternatives for Keypad
| |
|
|
|||
| |
|
|
|
|
|
| Component Life | |
|
|
|
|
| Weight (g) = | |
|
|
|
|
| Cost ($) = | |
|
|
|
|
| Width (in) = | |
|
|
|
|
| Power Usage (W) = | |
|
|
|
|
Table 13. Specifications for Commercial Keypad Options
Gathering the Data
The first step in conducting trade-off analysis was to gather the vender's performance data for their components and place it into our specification database. This structure will provide the tools used to formulate performance equations.
Decision Metrics
Metrics are determined in order to optimize the system for the most important criteria. The selection of HCU sub-components will be evaluated using 3 metrics. These will be the foundation for the analysis; equations will be structured in order to do the following:
Constraints
In addition to the metrics listed above, the sub-components will be evaluated based on additional performance constraints, selected to optimize the performance of the HCU. The constraints for the system are as follows:
Problem Formulation
Using the Vendor SPEC sheet, the metrics listed above and the constraints, linear equations are formulated to input into CPLEX, to optimize the system.
DESIGN VARIABLES
The design variables have the following interpretation:
X i = 1 for only one value of i = 1,2,3. Otherwise, X i = 0.
Y i = 1 for only one value of i = 1,2,3. Otherwise, Y i = 0.
Z i = 1 for only one value of i = 1,2,3. Otherwise, Z i = 0.
The mathematical equations based on the information is as follows:
DESIGN OPTIMIZATION
Maximize Component Life = 500 x 1 + 750 x 2 + 830 x 3 + 100 y 1 + 200 y 2 + 160 y 3 + 500 z 1 + 100 z 2 + 200 z 3
SUBJECT TO:
Minimize Weight= 850 x 1 + 750 x 2 + 650 x 3 + 300 y 1 + 450 y 2 + 250 y 3 + 900 z 1 + 750 z 2 + 800 z 3 <= K 1
Minimize Cost = 380 x 1 + 400 x 2 + 450 x 3 + 400 y 1 + 420 y 2 + 500 y 3 + 450 z 1 + 300 z 2 + 500 z 3 <= K 2
CONSTRAINTS:
500 x 1 + 750 x 2 + 830 x 3 >= 100
100 y 1 + 200 y 2 + 160 y 3 >= 100 *
500 z 1 + 100 z 2 + 200 z 3 >= 100 *
11 x 1 + 15 x 2 + 18 x 3 >= 10
5.5 x 1 + 6.0 x 2 + 6.5 x 3 >= 500
535 y 1 + 576 y 2 + 768 y 3 >= 500
5.0 z 1 + 5.5 z 2 + 6.0 z 3 >= 5.0
3.8 x 1 + 4.5 x2 + 2.8 x 3 + 5.6 y 1 + 6.3 y2 + 4.0 y 3 + 2.0 z 1 + 3.0 z2 + 2.8 z 3 <= 15
x 1 + x 2 + x 3 = 1
y 1 + y 2 + y 3 = 1
z 1 + z 2 + z 3 = 1
For the purpose of analysis, and in in order to produce better trade-off analysis results, product life was scaled from the hundred thousands to hundreds place.
Analysis Procedure
Each run of CPLEX maximizes the "so-called" system life (see editorial note below) while satisfying constraints for cost and weight controlled by the analysis variables K 1 and K 2.
The max/min range of permissible values can be obtained from the sum of attribute values in the table of design options. For example:
Min Possible Value of K 1 =
    = min ( 850, 750, 650 ) + min ( 300, 450, 250 ) + min ( 900, 750, 800 )
    = 650 + 250 + 750 = 1650.
Max Possible Value of K 1 =
    = max ( 850, 750, 650 ) + max ( 300, 450, 250 ) + max ( 900, 750, 800 )
    = 850 + 450 + 900 = 2200.
Now see the tables below.
Editorial Note
For mathematical convenience, the design objective of maximum component life has been represented:
But this formulation isn't quite right. The optimization of life in this case required determining the highest sub-component life, in order to maximize the total system life. This computation is difficult to represent as a linear equation, in essence it would have to pick the highest component life systems, then determine the lowest life of the total system (which is the weakest component) then optimize to find the longest lasting of the weakest system.
To conduct this optimization, the assumption was made to allow the sum the component lives to find the optimal system. From this data a spreadsheet was used to find the weakest sub-component of the system.
Figure 21. Procedure for dealing with the design objective "maximize system life."
The assumption was that the highest sum value of lives would include the best component solution. Since this is not completely reliable, constraints were added to the equation to further optimize life. See Figure 21 for a flowchart of these activities. The life constraint allowed the minimal acceptable life to be used as screening criteria.
Running CPLEX
Once the equations were determined, CPLEX was used to optimize the system. The variables K1 and K2 listed above were varied 12 times and run into CPLEX. CPLEX optimizes the solution and provides sub-component selections by allocating the number 1 by the optimal solution.
The results of the CPLEX runs are listed below (Table 2):
| |
|
|
||||||||||
| |
|
|
|
|
|
|
|
|
||||
| |
K 2 |
|
K 1 |
|
|
|
|
|
|
|
|
|
| |
|
|
|
|
|
|
|
|
|
|
|
|
| |
|
|
|
|
|
|
|
|
|
|
|
|
| |
|
|
|
|
|
|
|
|
|
|
|
|
| |
|
|
|
|
|
|
|
|
|
|
|
|
| |
|
|
|
|
|
|
|
|
|
|
|
|
| |
|
|
|
|
|
|
|
|
|
|
|
|
| |
|
|
|
|
|
|
|
|
|
|
|
|
| |
|
|
|
|
|
|
|
|
|
|
|
|
| |
|
|
|
|
|
|
|
|
|
|
|
|
| |
|
|
|
|
|
|
|
|
|
|
|
|
| |
|
|
|
|
|
|
|
|
|
|
|
|
| |
|
|
|
|
|
|
|
|
|
|
|
|
Table 14. CPLEX Run Results
Graphical Summary Performance Metrics for Initial Designs
Figure 22. Summary of Performance Metrics for Initial Designs: (1) Cost versus weight; (2) life versus weight; (3) life versus cost.
Procedure for Pareto Analysis
Using the data in Table 2, graphs were created in order to identify Pareto, metric trade-off, points. Analysis of these points produced the first set of optimal solutions.
Figure 23. Example of Pareto Point Analysis
As indicated in Figure 21, the Pareto points are the points where no gain of one metric is achieved without the loss of another metric.
First Pareto Plot Analysis
Following the analysis of the first trade-off graph Pareto points the six of the optimization solutions were eliminated resulting the in the following solution set:
| |
|
|
||||||||||
| |
|
|
|
|
|
|
|
|
||||
| |
K 2 |
|
K 1 |
|
|
|
|
|
|
|
|
|
| |
|
|
|
|
|
|
|
|
|
|
|
|
| |
|
|
|
|
|
|
|
|
|
|
|
|
| |
|
|
|
|
|
|
|
|
|
|
|
|
| |
|
|
|
|
|
|
|
|
|
|
|
|
| |
|
|
|
|
|
|
|
|
|
|
|
|
| |
|
|
|
|
|
|
|
|
|
|
|
|
Table 15. Results of the Initial Pareto Analysis
The following figure is a graphical summary of performance metrics for the six designs following the initial Pareto analysis.
Figure 24. Performance Metrics of Design Options remaining after the first round of Pareto Analysis
Second Pareto Plot Optimization
Using the results remaining from the first analysis (see Table 3), additional graphs were constructed to further analyze the solutions. The graphs are displayed in APPPENDIX H. Analysis of these graphs indicated a wide range of possible solutions; however, typical Pareto points were not selected from these results in their entirety.
Figure 25. Elimination of Design Options in Second Round of Pareto Analysis.
All of the points indicating life solutions of 100,000 uses were thrown out due to the availability of solutions ranging in the 160,000 to 200,000 life range. This was done due to the prioritization of the metrics with life being first, followed by weight, then cost (see APPENDIX I).
Following the second analysis, the possible solutions were reduced to the following:
| |
|
|
||||||||||
| |
|
|
|
|
|
|
|
|
||||
| |
K 2 |
|
K 1 |
|
|
|
|
|
|
|
|
|
| |
|
|
|
|
|
|
|
|
|
|
|
|
| |
|
|
|
|
|
|
|
|
|
|
|
|
| |
|
|
|
|
|
|
|
|
|
|
|
|
Table 16. Final Solution Design Options
System Optimization
Having narrowed the options to three remaining points, again graphs were constructed to assist in the final optimization of the system. We will now examine each remaining option in detail.
COMPONENT 1: OPTION 3 ANALYSIS
Analysis of Option 3 shows that its component combination maximizes system life with a value of 200,000 uses before failure. However, this combination also maximizes cost by bringing the total system cost to $2,000 per HCU. Additionally, this option maximizes the weight of the system at2000g. (See Figure 7).
Figure 26. Pareto Analysis for Design Option 3
SOLUTION 2: OPTION 6 COMPONENTS
Option 6 provides a relatively high value for life with 160,000 uses before failure. Of the three remaining options it is the lowest weight, weighing 50g less than the next closest option. However, it is the second highest costing option with a value of $1,600 per HCU system (see Figure 8).
Figure 27. Pareto Analysis of Option 6.
SOLUTION 3: OPTION 10 COMPONENTS
Option 10 offers a relatively long product life of 160,000 uses before failure. It does have the second highest weight, weighing 50g more than option 6. However, it is the lowest costing option, offering $160 savings per HCU when compared to it's closest competitor (see Figure 9).
Figure 28. Pareto Analysis of Option 10.
Component Configuration Recommendation
Final component selection requires quantifiable and subjective analysis of the trade-off data. The chart below summarizes the trade-off results (Table 5).
| |
|
|
|
||||||
| |
|
|
|
|
|||||
| |
|
|
|
|
|
|
|
|
|
| |
|
|
|
|
|
|
|
|
|
| |
|
|
|
|
|
|
|
|
|
| |
|
|
|
|
|
|
|
|
|
Table 17. Final Comparison (Pros versus Cons) of Design Options
Points to note are as follows:
This selection results in the following commercial component selection (Table 6):
| |
|
| LCD | LCD: LightView QVGA-0076 |
| CPU | Mango PCI FP32C |
| KEYPAD | Mark SYS INC |
Table 18. Vendor Selection Results
Figure 29. Schematic of Vendor Selection Results
System Test Plan
Insert material, Fall Semester 2003 ..... it's done, I have haven't had time to update the tutorial ... aghhh!
Icons
References and Web Resources
Developed by Adrian Marsh, Spring Semester 2003
Reformatted and slightly modified by Mark Austin, May 2003
Copyright © 2003, Adrian Marsh,
John Baras and Mark Austin. All rights reserved.