 Project Abstracts, Spring Semester 2022
[ Project 1 ]:
Prediction of Bridge Condition Rating using Neural Networks
[ Project 2 ]:
Machine Learning Algorithms to Predict the Strength of Concrete
[ Project 3 ]:
Short-term Freeway Speed Prediction: A Spatio-Temporal LSTM Model
[ Project 4 ]:
Impact of Hurricanes on Eviction Rates
[ Project 5 ]:
Predicting Power Output from Solar Panel Data Across the U.S.
[ Project 6 ]:
Predicting COVID-19 Vaccination Levels of ZCTAs Using Socioeconomic and Demographic Data
[ Project 7 ]:
Estimation of Pedestrian Volume for Brooklyn Bridge
[ Project 8 ]:
Solving Plate Buckling Problems with Neural Networks
PROJECT 1
Title: Prediction of Bridge Condition Rating using Neural Networks
Authors: Ainur Abilbayeva, and Naiyi Li
Abstract:
Deterioration of bridge structures plays an essential role in maintaining the
functionality of transportation networks as aging infrastructure becomes more prevalent.
Due to the complexity of bridge deterioration, prediction models derived using analytical
methods struggle to provide accurate prediction of the deterioration process.
This study utilizes neural networks to perform prediction on the condition rating of
the superstructure and substructures of bridges.
The dataset is obtained from two sources:
-
The National Bridge Inventory (NBI) for bridge
information from 1992 to 2020.
-
The Storm Events Database from the National Oceanic and Atmospheric Administration
(NOAA) is added to incorporate the effects of extreme weather events on the
condition rating of the bridges.
The events are primarily storms and floods.
This study aims to investigate the combined effects of natural and structural impacts on the
deterioration of bridge structures. In theory, the NBI dataset would reflect the natural
deterioration rate of bridges and the Storm Events Database may indicate sudden
drops in bridge condition ratings due to extreme weather events, for instance, scour
due to floods.
Figure 1a shows the bridge records in each condition states (CS1: best ~ CS4: worst).
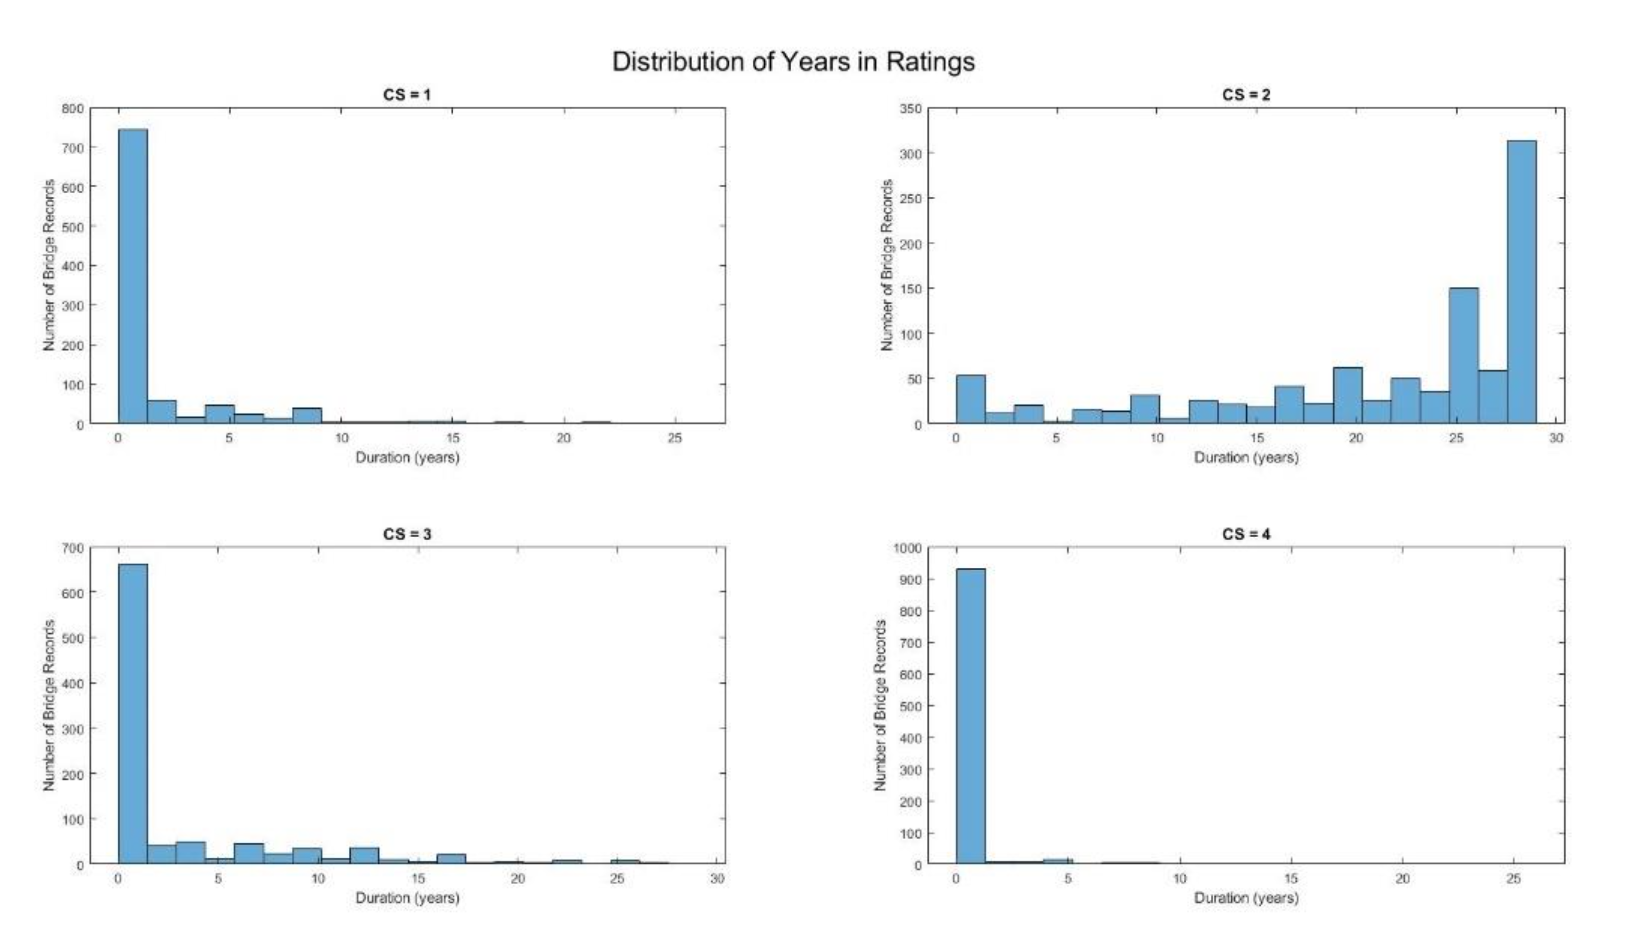
Figure 1a. ...
Table 1 shows a snippet of the NBI dataset.
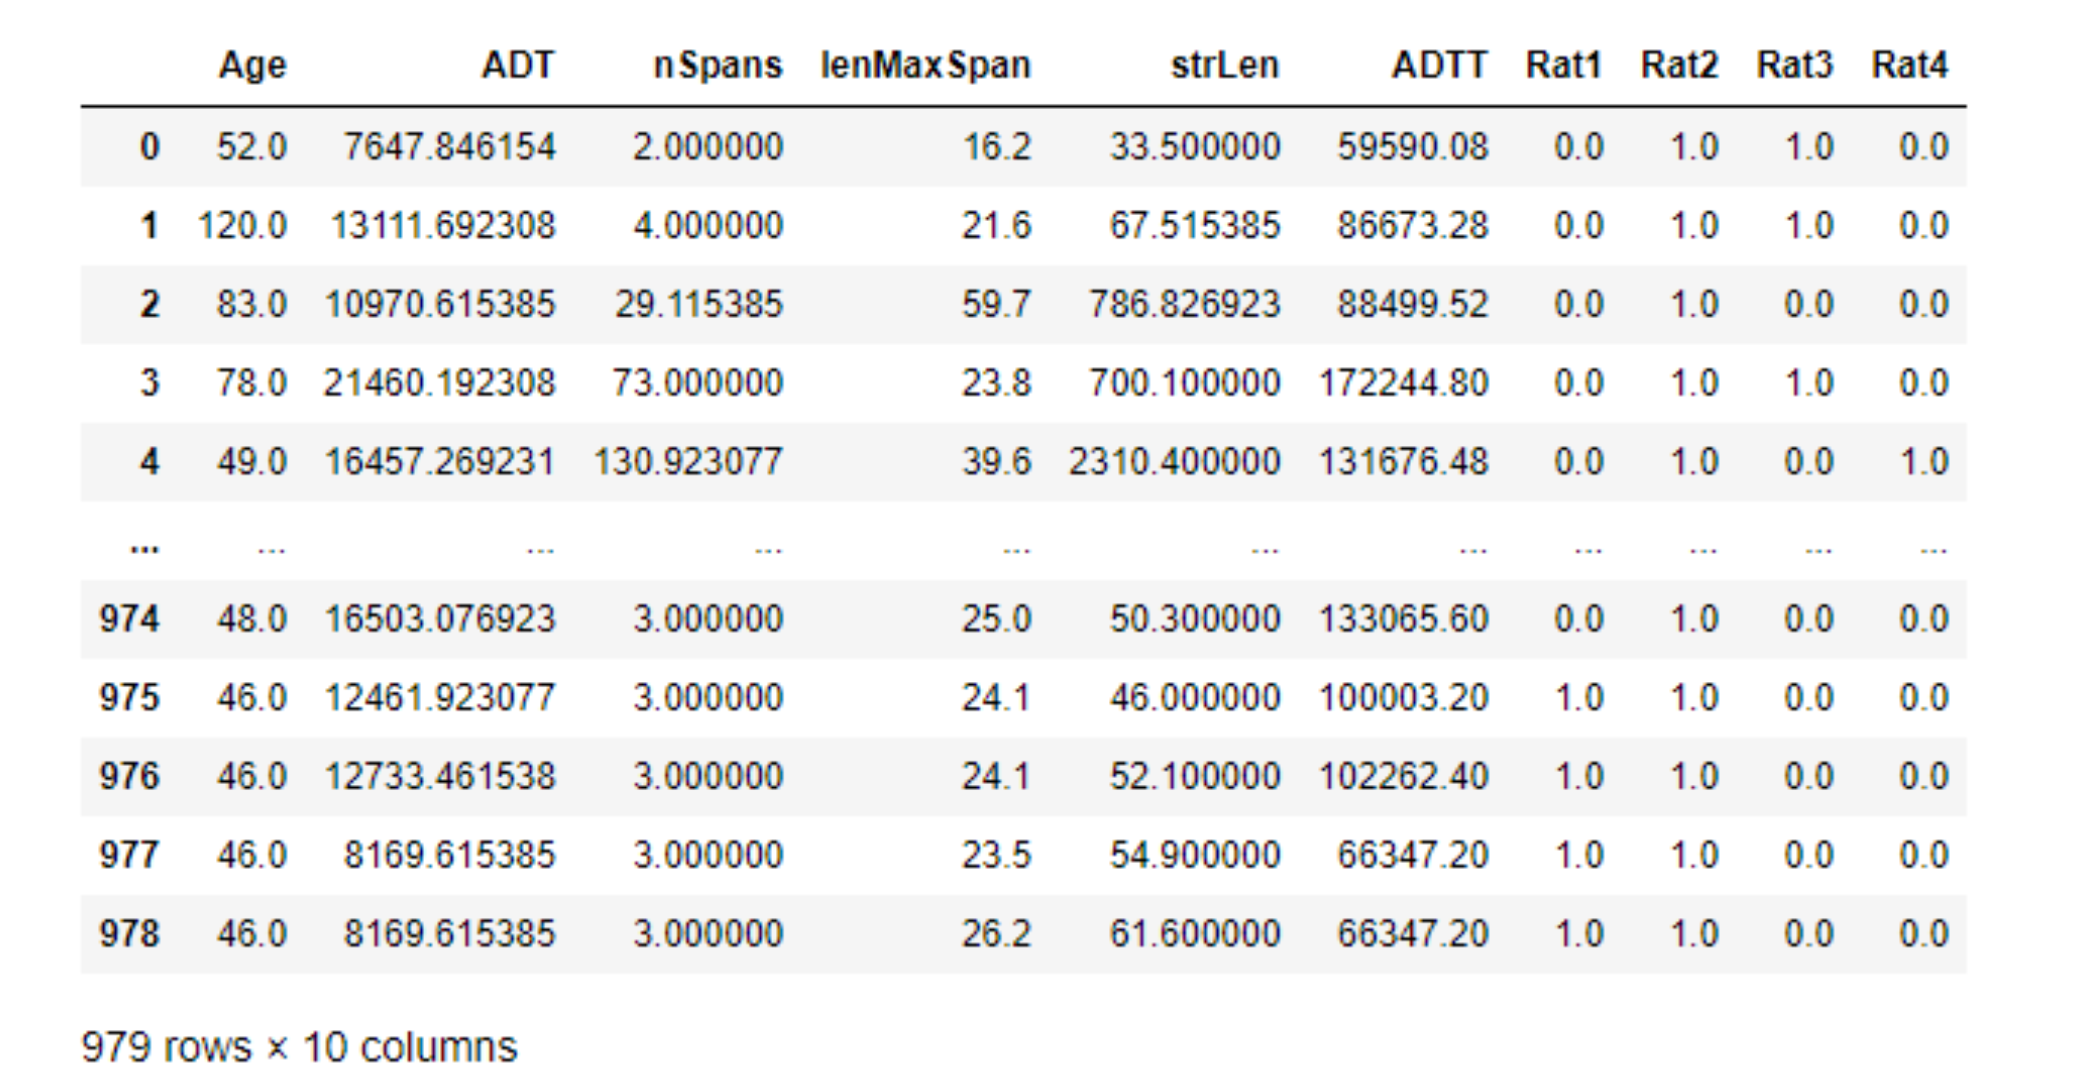
Table 1a. ...
Figure 1b shows the survival analysis using
Kaplan–Meier estimator, which can be used as a reference to the neural network.
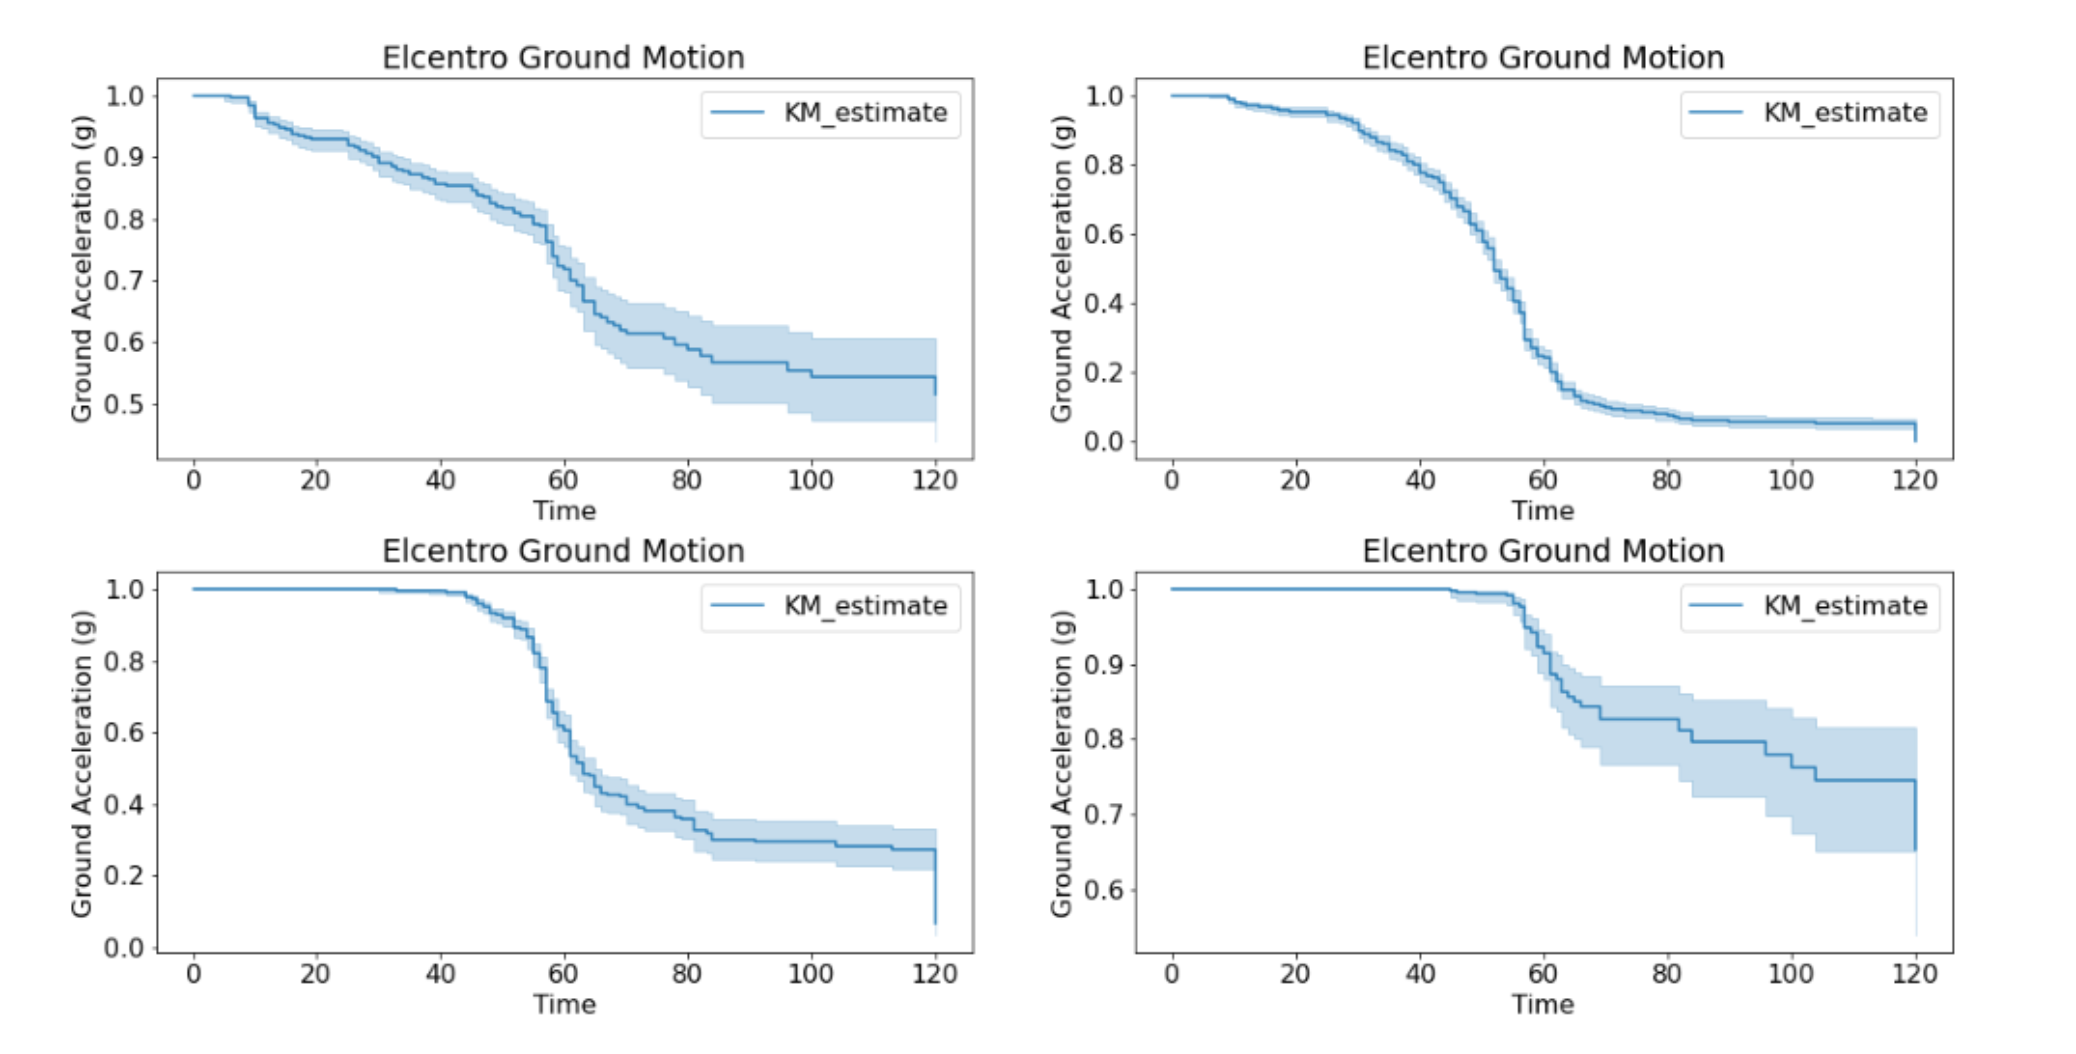
Figure 1b. Survival analysis using Kaplan-Meier estimator.
Data Sources
-
National Centers for Environmental Information Storm Events Database:
See: https://www.ncdc.noaa.gov/stormevents/
-
Long-Term Bridge Performance (LTBP) Program InfoBridgeTM:
See: https://infobridge.fhwa.dot.gov/
References
-
Cavalline, T. L., Whelan, M. J., Tempest, B. Q., Goyal, R., & Ramsey, J.D. (2016).
Determination of Bridge Deterioration Models and Bridge User Costs for the NCDOT Bridge Management System.
-
Goyal, R. (2015). Development of a Survival-based Framework for Bridge Deterioration
Modeling with Large-Scale Application to the North Carolina Bridge Management System.
-
Hosmer, D. W., Lemeshow, S., & May, S. (2008). Applied Survival Analysis:
Regression Modeling of Time-to-event Data. John Wiley & Sons.
-
Madanat, S., Mishalani, R., & Ibrahim, W. H. (1995).
Estimation of infrastructure transition probabilities from condition rating data.
Journal of Infrastructure Systems, 1(2), 120–125. https://doi.org/10.1061/(asce)1076-0342(1995)1:2(120)
-
U.S. Department of Transportation Federal Highway Administration. (n.d.).
LTBP InfoBridgeTM. Long-Term Bridge Performance (LTBP). https://infobridge.fhwa.dot.gov/.
-
Snaiki, R., Wu, T., Whittaker, A.S., & Atkinson, J.F. (2020).
Hurricane Wind and storm surge effects on coastal bridges under a changing climate.
Transportation Research Record: Journal of the Transportation Research Board, 2674(6),
23–32. https://doi.org/10.1177/0361198120917671
-
Lee, J.-W., Irish, J., Bensi, M., & Marcy, D. (2021).
Rapid prediction of peak storm surge from tropical cyclone
track time series using Machine Learning. https://doi.org/10.31223/x5ns6h
PROJECT 2
Title:
Machine Learning Algorithms to Predict the Strength of Concrete
Author: Jing Jing
Abstract:
Concrete is one of the important building materials in construction -- it is widely used all over the world.
Although we have a mature way to calculate its strength in order to evaluate its performance,
this project aims at finding another way using machine learning algorithms to predict
its strength by using its parameter data.
What’s more, compare to the traditional way, we also want to get to know its strength
after use it for years so that we can have a new way to monitor concrete component’s health.
This project will investigate the use of linear regression and
multi-layer perceptron regression models to predict concrete strength.
Figure 2a. Parameters for linear regression model.
Data Sources
-
See: https://archive.ics.uci.edu/ml/datasets/Concrete+Compressive+Strength

Figure 2b. UCI machine learning repository, concrete compressive strength data set.
References
-
I-Cheng Yeh, Modeling of strength of high performance concrete using artificial neural networks,
Cement and Concrete Research, Vol. 28, No. 12, pp. 1797-1808 (1998)
-
I-Cheng Yeh, Modeling Concrete Strength with Augment-Neuron Networks,
J. of Materials in Civil Engineering, ASCE, Vol. 10, No. 4, pp. 263-268 (1998).
-
I-Cheng Yeh, Design of High Performance Concrete Mixture Using Neural Networks,
J. of Computing in Civil Engineering, ASCE, Vol. 13, No. 1, pp. 36-42 (1999).
-
I-Cheng Yeh, Prediction of Strength of Fly Ash and Slag Concrete By The Use of Artificial Neural Networks,
Journal of the Chinese Institute of Civil and Hydraulic Engineering, Vol. 15, No. 4, pp. 659-663 (2003).
-
I-Cheng Yeh, A mix Proportioning Methodology for Fly Ash and Slag Concrete Using Artificial Neural Networks,
Chung Hua Journal of Science and Engineering, Vol. 1, No. 1, pp. 77-84 (2003).
-
I-Cheng Yeh, Analysis of strength of concrete using design of experiments and neural networks,
Journal of Materials in Civil Engineering, ASCE, Vol.18, No.4, pp.597-604 (2006).
PROJECT 3
Title:
Short-term Freeway Speed Prediction: A Spatio-Temporal LSTM Model
Authors: Yi-Ting Lin, and Yen-Lin Huang
Abstract:
Freeway speed prediction is one of a key components in the Intelligent Transportation System (ITS),
a robust prediction model can provide useful information for both the vehicle drivers
and traffic management agencies.
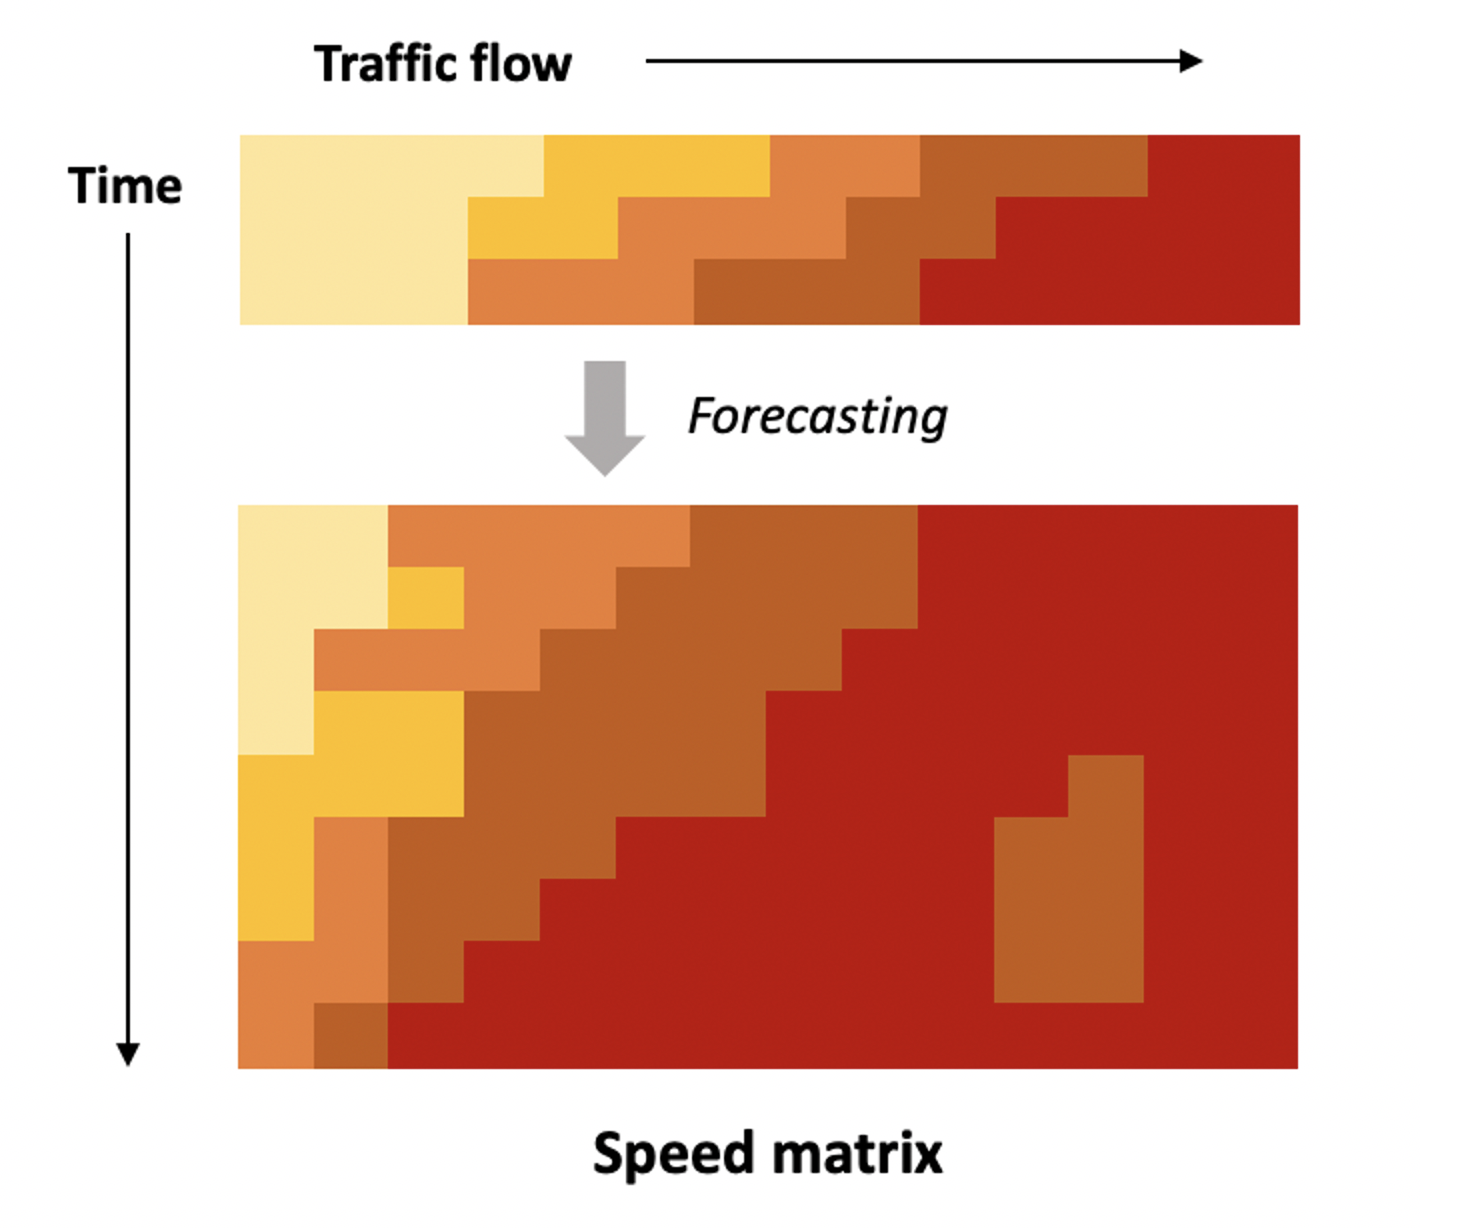
Figure 3a. Speed matrix of traffic flow vs time.
In response to such needs, temporal indications and spatial features are extracted
from the GPS-based speed data (i.e., probe speed),
and a LSTM model, which has been widely proven to be effective in modeling complex traffic flow problems,
is proposed to forecast the speed under recurring traffic and non-recurring traffic conditions.
Data Sources
-
Probe vehicle’s speed data of I-495 from RITIS database.
References
-
M.S. Ahmed and A. R. Cook. 1979. Analysis of freeway traffic time-series data by using box-jenkins techniques.
Transportation Research Record. No. 722, pp. 1-9.
-
P. Duan, G. Mao, C. Zhang, and S. Wang. 2016. STARIMA-based traffic prediction with time-varying lags.
IEEE 19th International Conference of Intelligent Transportation System. Nov., pp. 1610-1615.
-
Z. H. Mir and F. Filali. 2016. An adaptive Kalman filter based traffic prediction algorithm
for urban road network. 12th International Conference of Innovative Information Technology. Nov., pp. 1-6.
-
K.C. Chu, R. Saigal, and K. Saitou. 2016. Stochastic Lagrangian traffic flow modeling and real-time
traffic prediction. IEEE international Conference of Automatic Science. Aug., pp. 213-218.
-
B. Sun, W. Cheng, P. Goswami, and G. Bai. 2017. Flow-aware WPT K-nearest neighbours regression for
short-term traffic prediction. IEEE Symposium on Computers and Communications. Jul., pp. 48-53.
-
J. Tang, H. Wang, Y. Wang, X. Liu, and F. Liu. 2014. Hybrid prediction approach based on weekly
similarities of traffic flow for different temporal scales. Transportation Research Record. No. 2443, pp. 21-31.
-
W.C. Hong. 2011. Traffic flow forecasting by seasonal SVR with chaotic simulated annealing algorithm.
Neurocomputing. Vol. 74, No. 12-13, pp. 2096-2107.
-
M. Castro-Neto, Y.-S. Jeong, M.-K. Jeong, and L. D. Han. 2009. Online-SVR for short-term traffic flow
prediction under typical and atypical traffic conditions. Expert System Application. Vol. 36, No. 3, pp. 6164-6173.
-
S.H. Huang and B. Ran. 2003. An application of neural network on traffic speed prediction under adverse
weather condition. Transportation Research Board Annual Meeting.
-
W. Zheng, D.H. Lee, and Q. Shi. 2006. Short-term freeway traffic flow prediction: Bayesian combined
neural network approach. Journal of Transportation Engineering. Vol. 132, pp. 114-121.
-
A.J. Toestes, T. H. Silva, R. Assuncao, F. L. P. Duarte-Figueiredo, and A. A. F. Loureiro. 2016.
STRIP: A short-term traffic jam prediction based on logistic regression.
IEEE 84th Vehicular Technology Conference. Sep., pp. 1-5.
-
J. Tang, F. Liu, Y. Zou, W. Zhang, and Y. Wang. 2017. An improved fuzzy neural network for traffic speed
prediction considering periodic characteristic.
IEEE Transaction on Intelligent Transportation System. Vol. 18, No. 9, pp. 2340-2350.
-
Y. Jia, J. Wu, and Y. Du. 2016. Traffic speed prediction using deep learning method.
IEEE 19th International Conference of Intelligent Transportation System . Nov., pp. 1217-1222.
-
X. Ma, Z. Tao, Y. Wang, H. Yu, and Y. Wang. 2015. Long short-term memory neural network for
traffic speed prediction using remote microwave sensor data.
Transportation Research Part C: Emerging Technologies. Vol. 54, pp. 187-197.
-
Y. Jia, J. Wu, W. Ben-Akiva, R. Seshadri, and Y. Du. 2017. Rainfall-integrated traffic speed
prediction using deep learning method. IET Intelligent Transportation System. Vol. 11, No. 9, pp. 531-536.
-
X. Ma, Z. Dai, Z. He, J. Ma, Y. Wang. 2015. Large-scale transportation network congestion evolution
prediction using deep learning theory. PLos ONE. Vol. 10, No. 3.
-
X. Ma, Z. Dai, Z. He, J. Ma, Y. Wang, and Y. Wang. 2017. Learning traffic as images: A deep convolutional
neural network for large-scale transportation network speed prediction. Sensors. Vol 17, No. 4, p. 818.
-
X. Cheng, R. Zhang, J. Zhou, and W. Xu. 2017. DeepTransport: Learning spatial-temporal dependency for
traffic condition forecasting. [Online].
-
Y. Li, R. Yu, C. Shahabi, and Y. Liu. 2018. Diffusion convolutional recurrent neural network: Data-driven
traffic forecasting. In. Conf. Learn. Represent.
-
D. Woodard, G. Nogin, P. Koch, D. Racz, M. Goldzmidt, and E. Horvitz. Predicting travel time reliability
using mobile phone GPS data. Transportation Research Part C: Emerging Technologies. Vol. 75, pp. 30-44.
-
Z. Gurmu and F. Wei. 2014. Artificial neural network travel time prediction model for buses using only GPS data.
Journal of Public Transportation. Vol. 17, No. 2, pp. 45-65.
-
A.T. Baptista, E. P. Bouillet, and P. Pompey. 2012. Towards an uncertainty aware short-term travel time
prediction using GPS bus data: case study in Dublin.
IEEE International Conference Intelligent Transportation Systems. Anchorge, pp. 1620-1625.
-
D.B. Work, O. P. Tossavainen, S. Blandin, M. A. Bayen, T. Iwuchukwu, and K. Tracton. 2008.
An ensemble Kalman filtering approach to highway traffic estimation using GPS enabled mobile devices.
IEEE Conference of Decision and Congrol. Mexico, pp. 5062-5068.
-
X. Niu, Y. Zhu, and X. Zhang. 2015. DeepSense: a novel learning mechanism for traffic prediction
with taxi GPS traces. IEEE Global Communications Conference. Austin, pp. 2745-2750.
-
E. Necula. 2014. Dynamic traffic flow prediction based on GPS data. IEEE 26th Conference of
Tools with Artificial Intelligence. Cyprus, pp. 922-929.
-
L.J.W.C. Van, S. P. Hoogendoorn, and Z. H. J. Van. 2005. Accurate freeway travel time prediction with
state-space neural networks under missing data.
Transportation Research Part C: Emerging Technologies. Vol. 13, No. 5-6, pp. 347-369.
-
M. Yildirimogul and N. Geroliminis. 2013. Experienced travel time prediction for congested freeways.
Transportation Research Part B: Methodological. Vol. 53, No. 4, pp. 45-63.
-
S. Dunne and B. Ghosh. 2012. Regime-based short term multivariate traffic condition forecasting algorithm.
Journal of Transportation Engineering. Vol. 138, No. 4, pp. 455-466.
-
J. Yeon, L. Elefteriadou, and S. Lawphongpanich. 2008. Travel time estimation on a freeway using discrete time
Markov chains. Transportation Part B: Methodological. Vol. 42, No. 4, pp. 325-338.
-
C.S. Li and M. C. Chen. 2013. Identifying important variables for predicting travel time of freeway with
non-recurrent congestion with neural networks. Neural Computation Application. Vol. 23, No. 6, pp. 325-338.
-
X. Fei, C. C. Lu, and K. Liu. 2011. A Bayesian dynamic linear model approach for real-time short-term
freeway travel time prediction. Transportation Research Part C: Emerging Technologies. Vol. 19, No. 6, pp. 1611-1629.
-
C. S. Li and M. C. Chen. 2014. A data mining based approach for travel time prediction in freeway with
non-recurrent congestion. Neurocomputing. Vol. 133, No. 8, pp. 74-83.
-
W. Huang, G. Song, H. Hong, and K. Xie. 2014. Deep architecture for traffic flow prediction:
deep belief networks with multitask learning.
IEEE Transactions on Intelligent Transportation System. Vol. 15, No. 5, pp. 2191-2201.
-
J. Wang, Q. Gu, J. Wu, G. Liu, and Z. Xiong. 2016. Traffic speed prediction and congestion source exploration:
a deep learning method. IEEE 16th International Conference of Data Mining. Brazil, pp. 1217-1222.
-
Z. Zhao, W. Chen, X. Wu, P. C. Y. Chen, and J. Liu. 2017. LSTM network: a deep learning approach for
short-term traffic forecast. IET Intelligent Transportation System. Vol. 11, No. 2, pp. 68-75.
-
N.G. Polson and V.O. Sokolov. 2017. Deep learning for short-term traffic flow prediction.
Transportation Research Part C: Emerging Technologies. Vol. 79, pp. 1-17.
-
M.T. Asif et al. 2014. Spatiotemporal patterns in large-scale traffic speed prediction.
IEEE Transaction of Intelligent Transportation System. Vol. 15, No. 2, pp. 794-804.
PROJECT 4
Title: Impact of Hurricanes on Eviction Rates
Author: Adriana Bryant and Caitlin Kenney
Abstract:
The goal of this project is to identify any patterns between hurricane and
tropical storm severity/intensity on county eviction rates.
The hypothesis is that the number of evictions increases due to storm intensity,
given that the damage inflicted by the storm forces many to leave their homes.
Unable to return until the damage can be fixed,
we hypothesize that the response time (time between storm and aid funding is received)
and the amount of FEMA aid may contribute to the eviction rate.
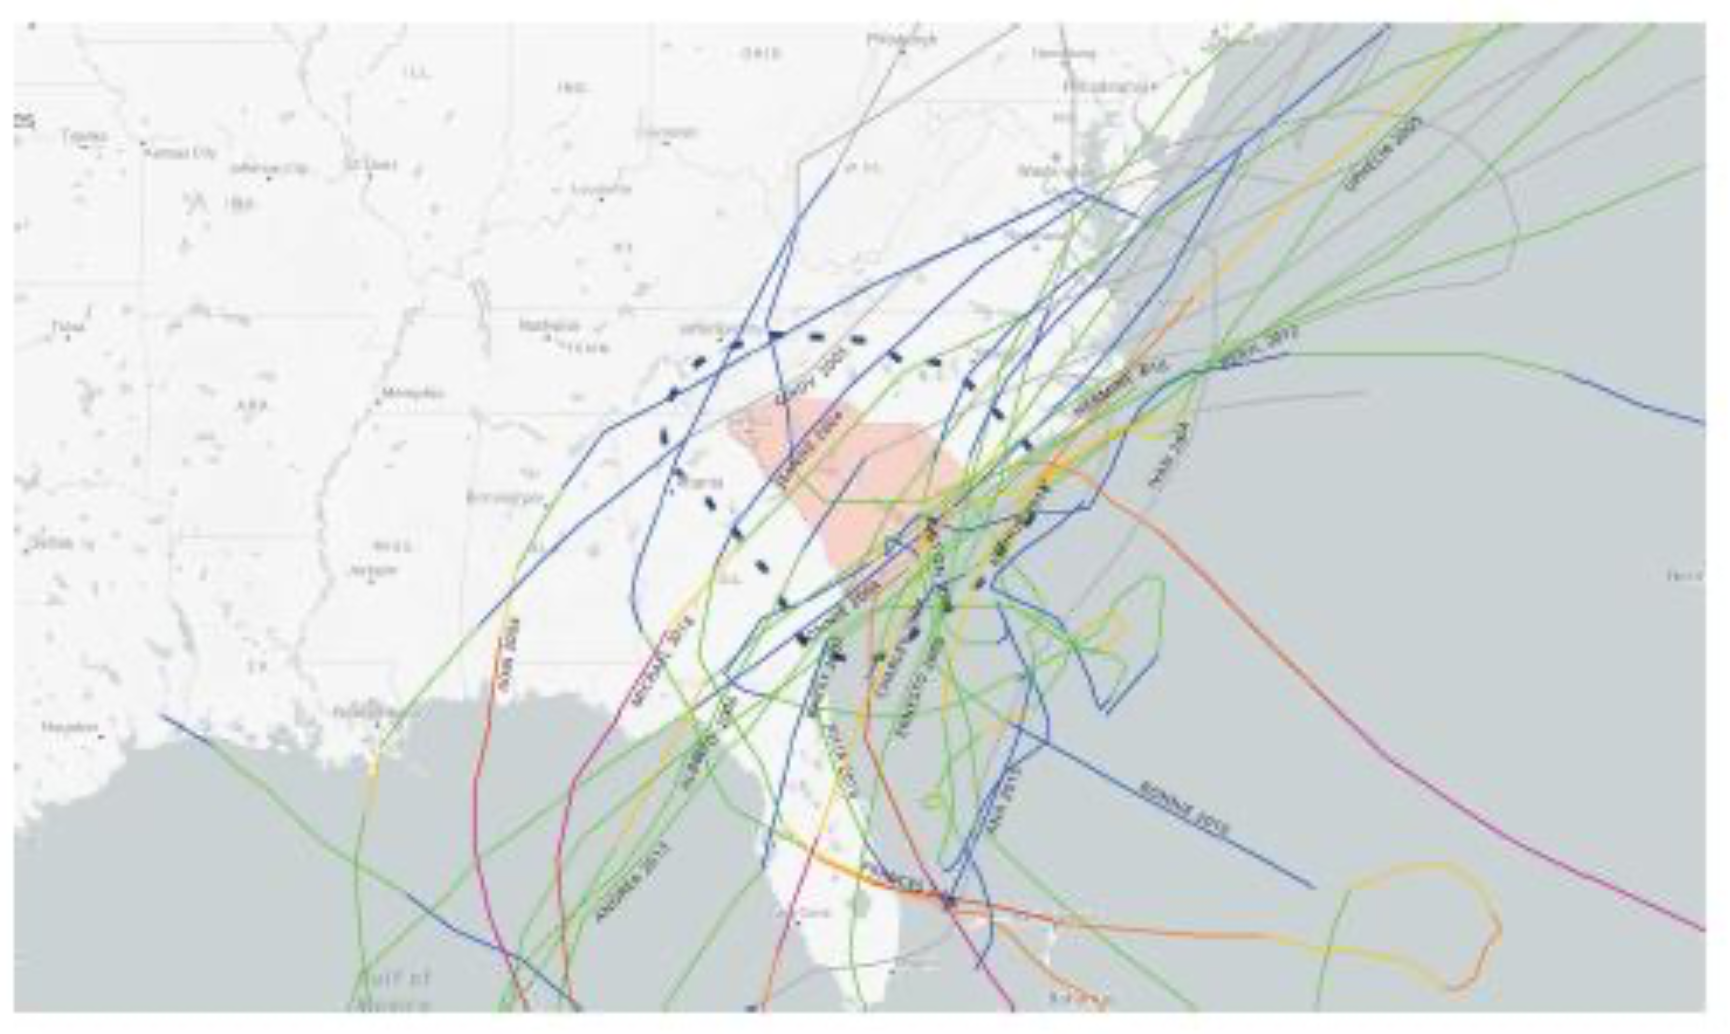
Figure 4a. Hurricane trajectories over South Carolina, circa 2004-2018.
This project will focus on South Carolina county data ranging from 2004 -2018;
SC has one of the highest rates of evictions in the
US over the past 20 years;
they also have had a number of tropical storms and hurricanes during that time period.
The outcome of this project will be a visualization based on data classifiers using Weka.
Data Sources
-
Eviction Lab data for SC (circa 2004-2018).
-
NOAA for hurricanes in SC (circa 2004-2018).
References
-
Funding from FEMA (post storm) (circa 2004 -2018).
-
Beyond Disasters: A Longitudinal Analysis of Natural Hazards’ Unequal Impacts
on Residential Instability.
PROJECT 5
Title:
Predicting Power Output from Solar Panel Data Across the U.S.
Authors: Timothy Henderson
Abstract:
The goal of this project is to use a dataset collected from various sites with
solar panels across the U.S. to predict power output levels.
The U.S. is currently in a transitory period between nonrenewable and renewable energy.
This process has only begun, so determining the optimal placement of solar panels
throughout such an enormous country can prove to be challenging.
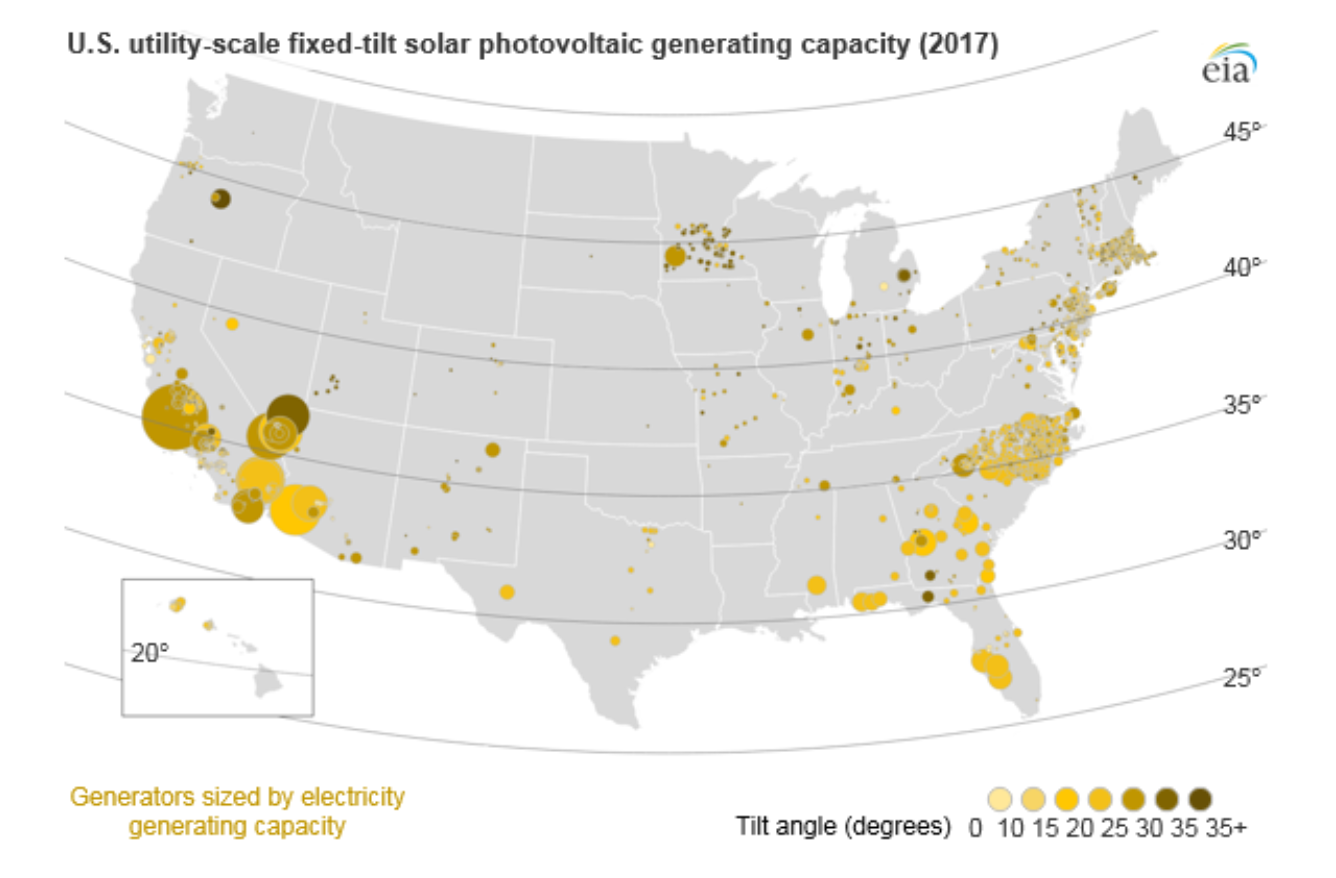
Figure 5a. Solar generation capacity throughout the U.S. in 2017.
My project aims to create a model to predict the power output of a
solar panel setup based on various factors such as location, weather, temperature etc.
If the model proves to be accurate, it could be used as an indicator for energy companies,
governments, or individuals for where in the U.S. to place solar panels for maximum efficiency.
Data Sources
-
https://www.kaggle.com/datasets/saurabhshahane/northern-hemisphere-horizontal-photovoltaic
References
-
https://www.emerald.com/insight/content/doi/10.1016/j.aci.2019.11.002/full/html
-
https://www.energy.gov/eere/solar/solar-forecasting-2
-
https://forecast.solar/
PROJECT 6
Title:
Predicting COVID-19 Vaccination Levels of ZCTAs Using Socioeconomic and Demographic Data
Author: Fei Wu
Abstract:
Since the start of COVID-19 vaccine rollout following FDA’s permission in December 2020,
vaccination progress has shown pronounced inequality across different areas in the country,
which is partly responsible for differences in COVID hospitalization and fatality rates.
Researchers have found such inequality attributable to socioeconomic and demographic
factors like income level, race composition, and education level,
using relatively simple regression methods.
In this project, we intend to train a prediction model that estimates
the level of COVID-19 vaccination progress at the ZIP code level,
with inputs of socioeconomic and demographic variables.
Among the available demographic and vaccination datasets,
data of New York City, Chicago and California will be the training set,
while data of Massachusetts will be the validation set.
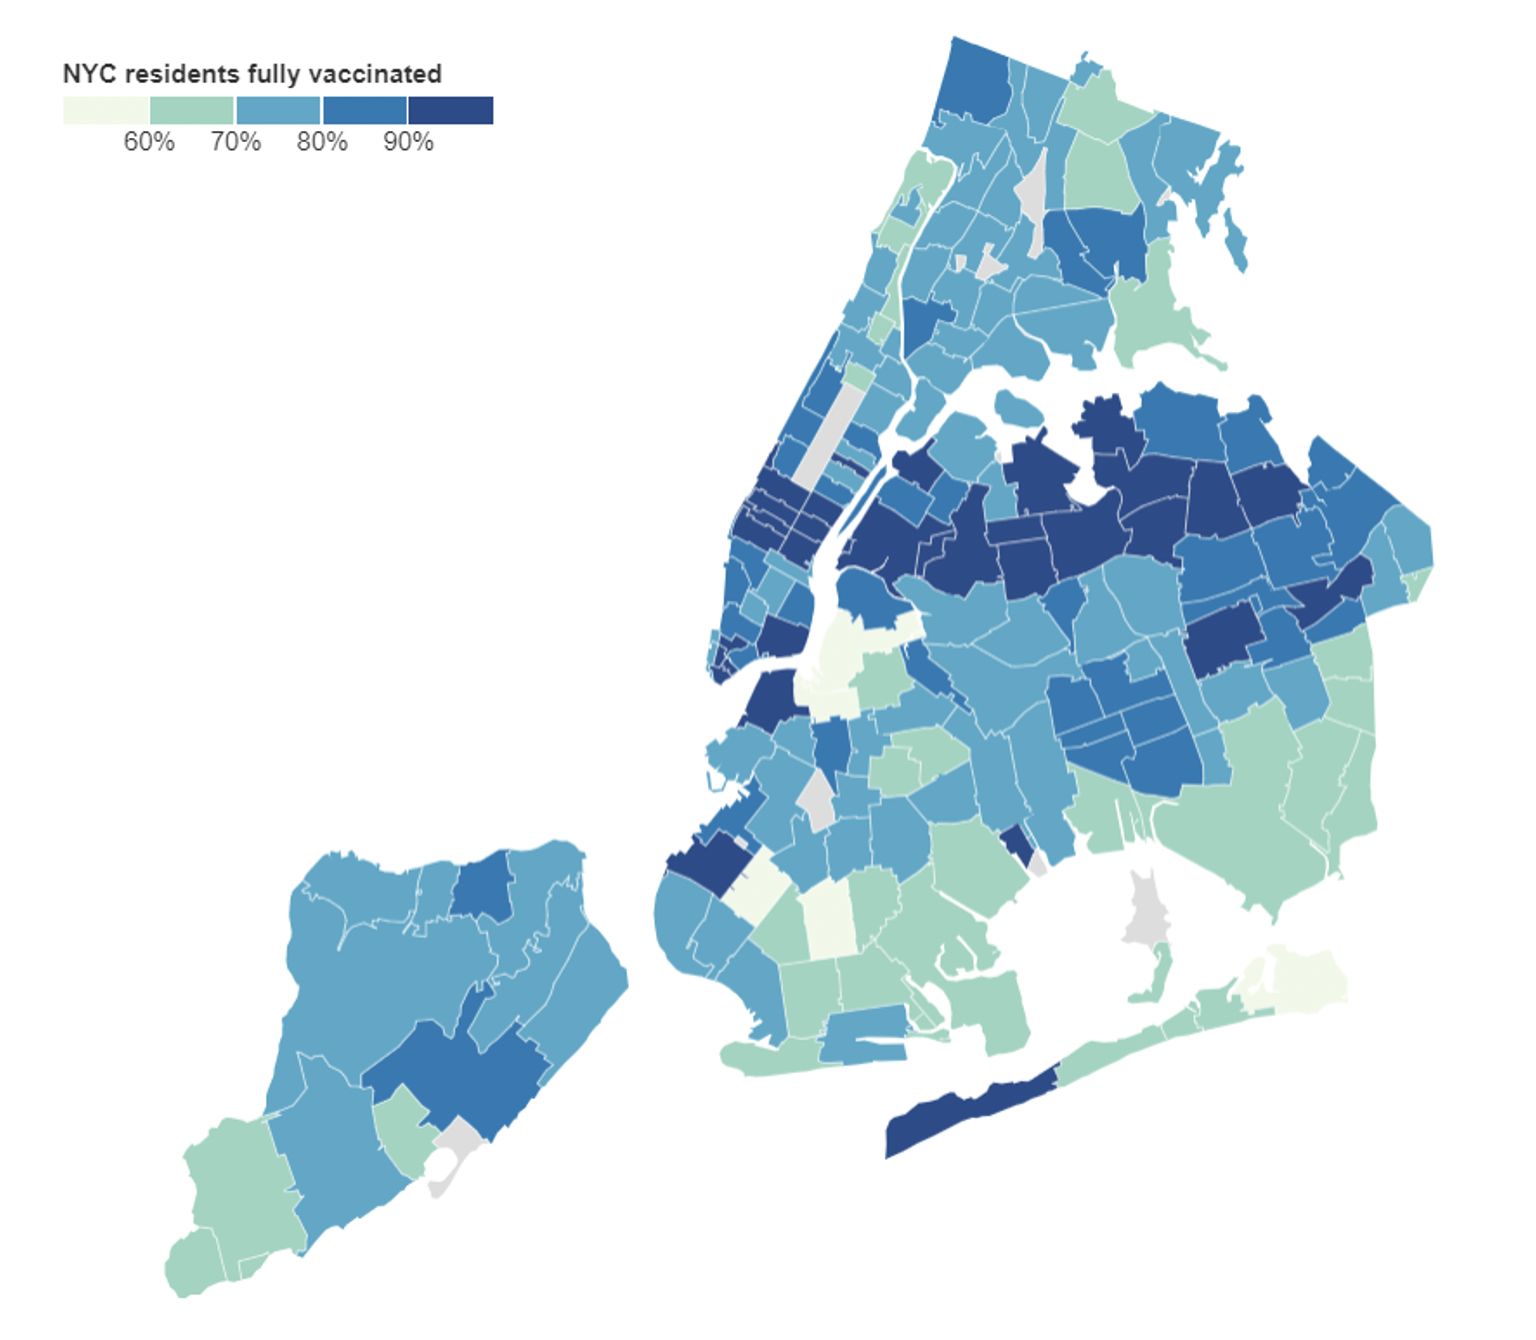
Figure 1a. County-level rates of vaccination for COVID-19 in New York City.
We will try two or three data mining and machine learning methods
and compare their performances.
When using decision trees including the J48 classifier,
bagging method will be applied to the training set.
Neural networks with no or one hidden layer will also be
applied with optimizable weights on input attributes for better
predictions of pre-stratified vaccination levels.
Using the model with the highest prediction accuracy,
we may identify the most indicative input attributes and
estimate the ZIP-level vaccination levels of states
and cities where recorded ZIP-level vaccination data are absent.
Data Sources
-
Zip Code Tabulation Areas (ZCTA), provided by US Census Bureau.
Shape files can be used for showing predicted vaccination levels by ZIP codes.
-
2020 American Community Survey 5-year population estimates (from U.S. Census Bureau).
This dataset contains nationwide ZIP-code level estimated data of various
demographic attributes as of 2020, including percentages of genders, age groups, race and ethnicity, etc.
-
COVID-19 Vaccine Progress Dashboard Data by ZIP Code (California last updated on 4/17/2022, no booster data)
-
COVID-19 Vaccinations by ZIP Code (Chicago, last updated 4/15/2022, no booster data)
-
Weekly COVID-19 Municipality Vaccination Data (Massachusetts, last updated 4/14/2022, booster included)
-
Vaccinations by ZIP code (NYC, last updated 4/15/2022, booster included,
uses modified ZCTA that combines very small census blocks)
(urlfile="https://raw.githubusercontent.com/nychealth/covid-vaccine-data/main/people/coverage-by-modzcta-allages.csv")
Items 3 through 6 record numbers and percentages of people who
are partially and fully vaccinated in each ZCTA.
References
-
Bor, J., Assoumou, S.A., Lane, K., Diaz, Y., Ojikutu, B., Raifman, J., and Levy, J.I. (2022).
Inequities in COVID-19 vaccine and booster coverage across Massachusetts ZIP codes:
large gaps persist after the 2021/22 Omicron wave. medRxiv.
-
Mofleh, D., Almohamad, M., Osaghae, I., Bempah, S., Zhang, Q., Tortolero, G., ... and Sharma, S. V. (2022).
Spatial Patterns of COVID-19 Vaccination Coverage by Social Vulnerability Index and Designated COVID-19
Vaccine Sites in Texas. Vaccines, 10(4), 574.
-
Rich, J., Miech, E., Bilal, U., and Corbin, T. (2022). How Education and Racial Segregation Intersect in
Neighborhoods with Persistently Low COVID-19 Vaccination Rates in Philadelphia.
-
Sacarny, A., and Daw, J. R. (2021, September).
Inequities in COVID-19 vaccination rates in the 9 largest US cities.
In JAMA Health Forum (Vol. 2, No. 9, pp. e212415-e212415). American Medical Association.
-
Sen-Crowe, B., Lin, I. C., Alfaro, R., McKenney, M., and Elkbuli, A. (2021).
COVID-19 fatalities by zip codes and socioeconomic indicators across various US regions.
Annals of Medicine and Surgery, 67, 102471.
-
PROJECT 7
Title: Estimation of Pedestrian Volume for Brooklyn Bridge
Author: Hanson Liao
Abstract:
The United States is experiencing an unprecedented pedestrian fatality crisis,
with pedestrian and bicyclist fatalities increasing by 53% and 36% respectively
since 2015 (Wallace et. al., 2021).
As of May 2021, pedestrian deaths in NYC had surged from 26 to 41.
This is a 58% increase in fatalities (Governors Highway Safety Association, 2022).
While probable causes ranges from speeding, distracted driving, larger vehicles, etc,
the bottom line is that cities in the US need accurate and predictable
assessments of pedestrian volume, in order to implement traffic solutions;
Specifically, a machine to predict pedestrian volumes for upcoming days.
This project will use data mining techniques to estimate
pedestrian volume for the Brooklyn Bridge.
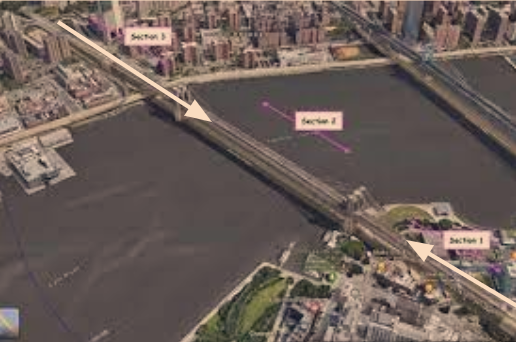
Figure 7a. Aerial view of Brooklyn Bridge.
We will use The Brooklyn Bridge as a representative case study,
called the Brooklyn Bridge Automated Pedestrian Counts (2017 - 2019) -- see details below.
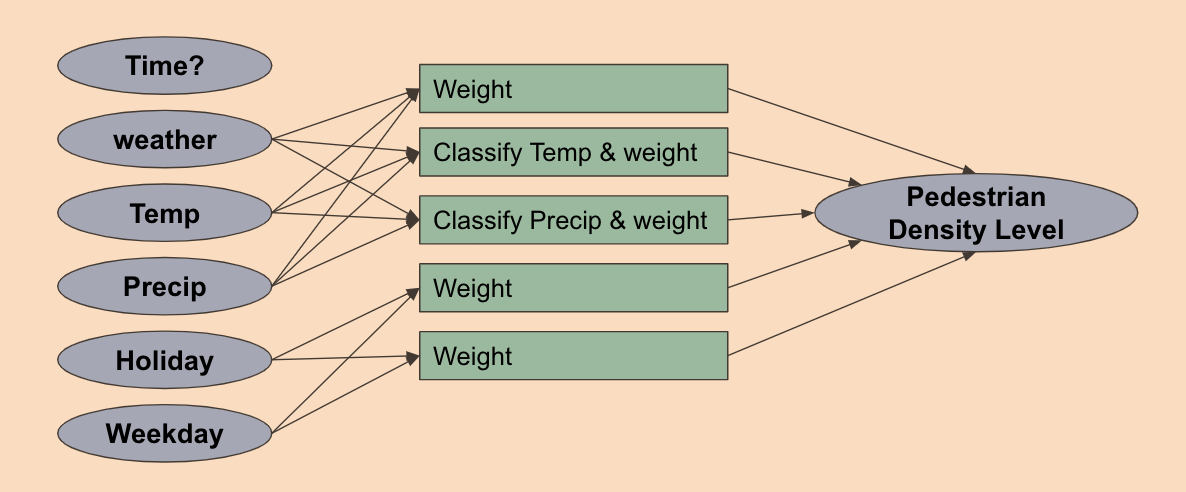
Figure 7b. Preliminary framework for estimation of pedestrian density.
Current challenges include:
-
Cleaning the dataset by removing incomplete da
and narrowing the scope of interest to one time of day,
likely peak hour between 2-5pm.
-
We must also add a new variable of Weekday data attribute.
-
Classification of ranges, including pedestrian count and precipitation should be
decided to simplify the machine learning process. based on levels.
Finally, rescaling of Precipitation data to be significant to machine is needed.
We will utilize WEKA for the data mining.
75% of the data will be used for training in for the J48 Tree.
The remaining 25% of the data will be used for testing.
The machine will learn to cluster weather, weekday type,
and holiday characteristics to levels of visitor volume.
If successful, this study could be repeated for for more crowded/higher risk intersections of NYC,
thereby improving our understanding of traffic patterns and reduction of crashes/accidents
Data Sources
-
The Brooklyn Bridge Automated Pedestrian Counts (2017 - 2019) dataset include:
-
Date and Hourly Pedestrian count (# visitors entered/ hr of date)
-
Weather summary (clear, partly-cloudy, cloudy, rain, fog)
-
Temperature (F)
-
Precipitation (Inches)
-
Holidays (US holidays)
References
-
Wallace, M., Kitson, C., Ormstrup, M., Cherian, J., & Saleh, J. H. (2021).
Pedestrian and light transit accidents: an examination of street redesigns
in Atlanta and their safety outcomes. Case studies on transport policy, 9(2), 538-554.
-
Levulytė, L., Baranyai, D., Sokolovskij, E., & Török, Á. (2017).
Pedestrians’ role in road accidents. International Journal for Traffic and Transport Engineering, 7(3), 328-341.
-
Governors Highway Safety Association, and the NYC department of Public transportation (2021)
-
Mohamed, M. G., Saunier, N., Miranda-Moreno, L. F., & Ukkusuri, S. V. (2013).
A clustering regression approach: A comprehensive injury severity analysis of
pedestrian–vehicle crashes in New York, US and Montreal, Canada. Safety science, 54, 27-37.
-
Yasmin, S., Eluru, N., & Ukkusuri, S. V. (2014). Alternative ordered response frameworks for
examining pedestrian injury severity in New York City. Journal of Transportation Safety & Security, 6(4), 275-300.
-
Song, L., Fan, W. D., Li, Y., & Wu, P. (2021).
Exploring pedestrian injury severities at pedestrian-vehicle crash hotspots with an annual upward trend:
A spatiotemporal analysis with latent class random parameter approach. Journal of safety research, 76, 184-196.
PROJECT 8
Title: Solving Plate Buckling Problems with Neural Networks
Author: Ahmet Mehdi Darilmaz
Abstract:
Understanding the behavior of structural elements is a key aspect of making
the most efficient and economic design.
An alternative way to fulfill this task is to use Physics Informed Neural Networks (PINNs).
Having the computer learn from the analytical and experimental data brings a
broader understanding to the actual physical problems.
This may help improving empirical equations used in structural design or
discover different aspects of physical phenomena.
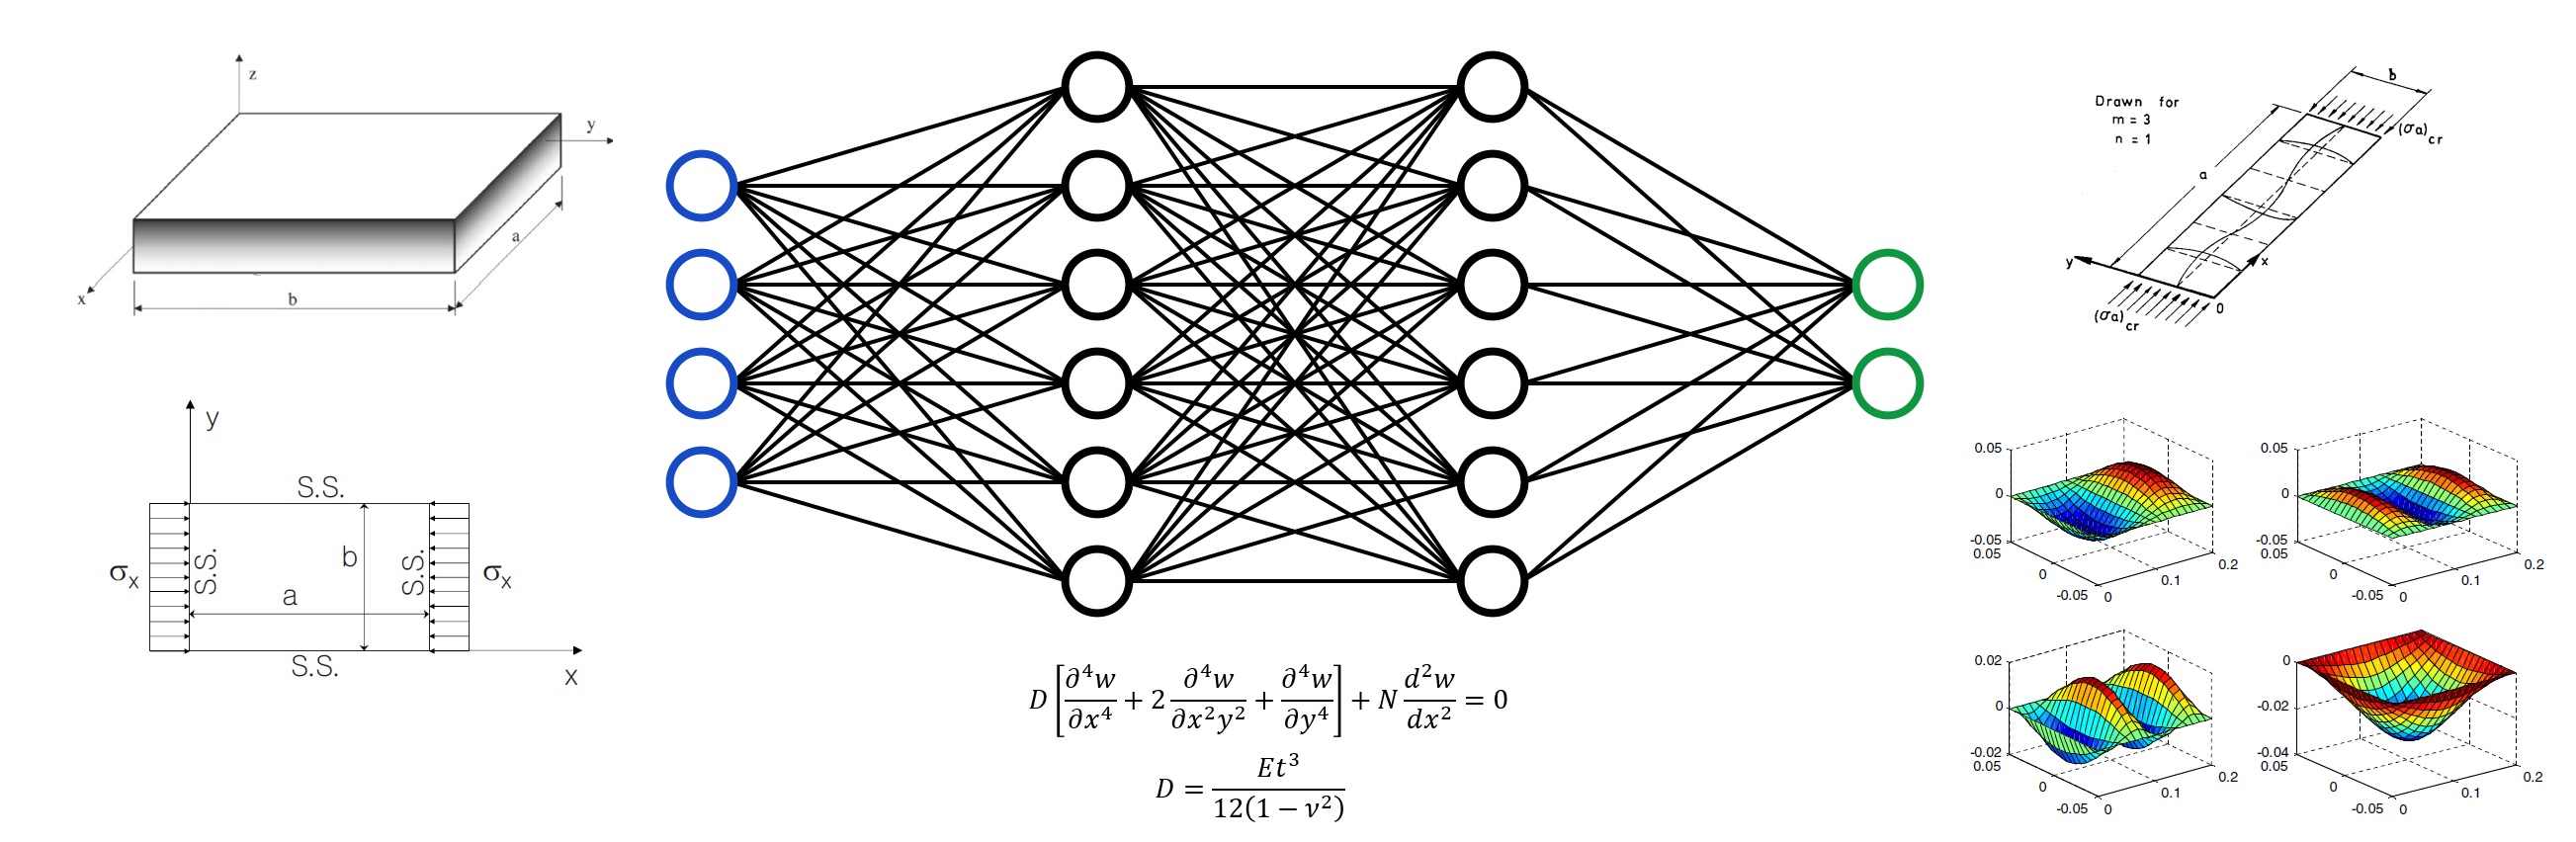
Figure 8a. Modeling plate buckling behavior with physics-informed neural networks.
The purpose of this project will be to examine the plate buckling problem
with an eye to achieving a deeper understanding for how PINNs might be
applied to the solution of structural analysis problems.
The neural network was trained to understand the governing equation that
maps out the position of points on the plate after buckling.
A custom loss function involving the residual values coming from boundary conditions,
initial conditions and the governing equation was used for optimizing the network.
The usage of PINNs for analyzing structural elements can be
extended to more complex problems and real-life applications.
References
-
Becque, J. (2010). Inelastic Plate buckling. Journal of Engineering Mechanics,
136(9), 1123–1130. https://doi.org/10.1061/(asce)em.1943-7889.0000075
-
Bleich, F. (1952). Buckling strength of metal structures. McGraw-Hill.
-
Duong, H. T., Phan, H. C., Tran, T. M., & Dhar, A. S. (2021).
Assessment of critical buckling load of functionally graded plates using artificial neural network modeling.
Neural Computing and Applications, 33(23), 16425–16437. https://doi.org/10.1007/s00521-021-06238-6
-
Lagaris, I. E., Likas, A., & Fotiadis, D. I. (1998).
Artificial neural networks for solving ordinary and partial differential equations.
IEEE Transactions on Neural Networks, 9(5), 987–1000. https://doi.org/10.1109/72.712178
-
Lu, L., Meng, X., Mao, Z., & Karniadakis, G. E. (2021).
DeepXDE: A deep learning library for solving differential equations.
SIAM Review, 63(1), 208–228. https://doi.org/10.1137/19m1274067
-
Raissi, M., Perdikaris, P., & Karniadakis, G. E. (2019).
Physics-informed Neural Networks: A deep learning framework for solving
forward and inverse problems involving nonlinear partial differential equations.
Journal of Computational Physics, 378, 686–707. https://doi.org/10.1016/j.jcp.2018.10.045
-
Timoshenko, S., & Gere, J. M. (2009). Theory of elastic stability. Dover Publications.
-
Wu, X., Ghaboussi, J., & Garrett, J. H. (1992).
Use of neural networks in detection of structural damage.
Computers & Structures, 42(4), 649–659. https://doi.org/10.1016/0045-7949(92)90132-j
-
Zhao, X., Lee, Y. Y., & Liew, K. M. (2009).
Mechanical and thermal buckling analysis of functionally graded plates.
Composite Structures, 90(2), 161–171. https://doi.org/10.1016/j.compstruct.2009.03.005
Last Modified: April 26, 2022,
Copyright © 2022, Department of Civil and Environmental Engineering, University of Maryland.