[ Project 1 ]: Human Mobility Prediction and Interpretation using Tree-based Approaches
[ Project 2 ]: Factor Assessment on NYC Car Crash Severity
[ Project 3 ]: Prediction of the Emergence of Gentrification using OpenStreetMap Data
Title: Human Mobility Prediction and Interpretation using Tree-based Approaches
Author: Songhua Hu, Weiyu Luo
Abstract: Location-based service (LBS) data are emerging data sources in the transportation domain which contain large-scale, fine-grained, near real-time information in human mobility [1]. However, limited studies have built forecasting models based on human mobility extracted from LBS data.
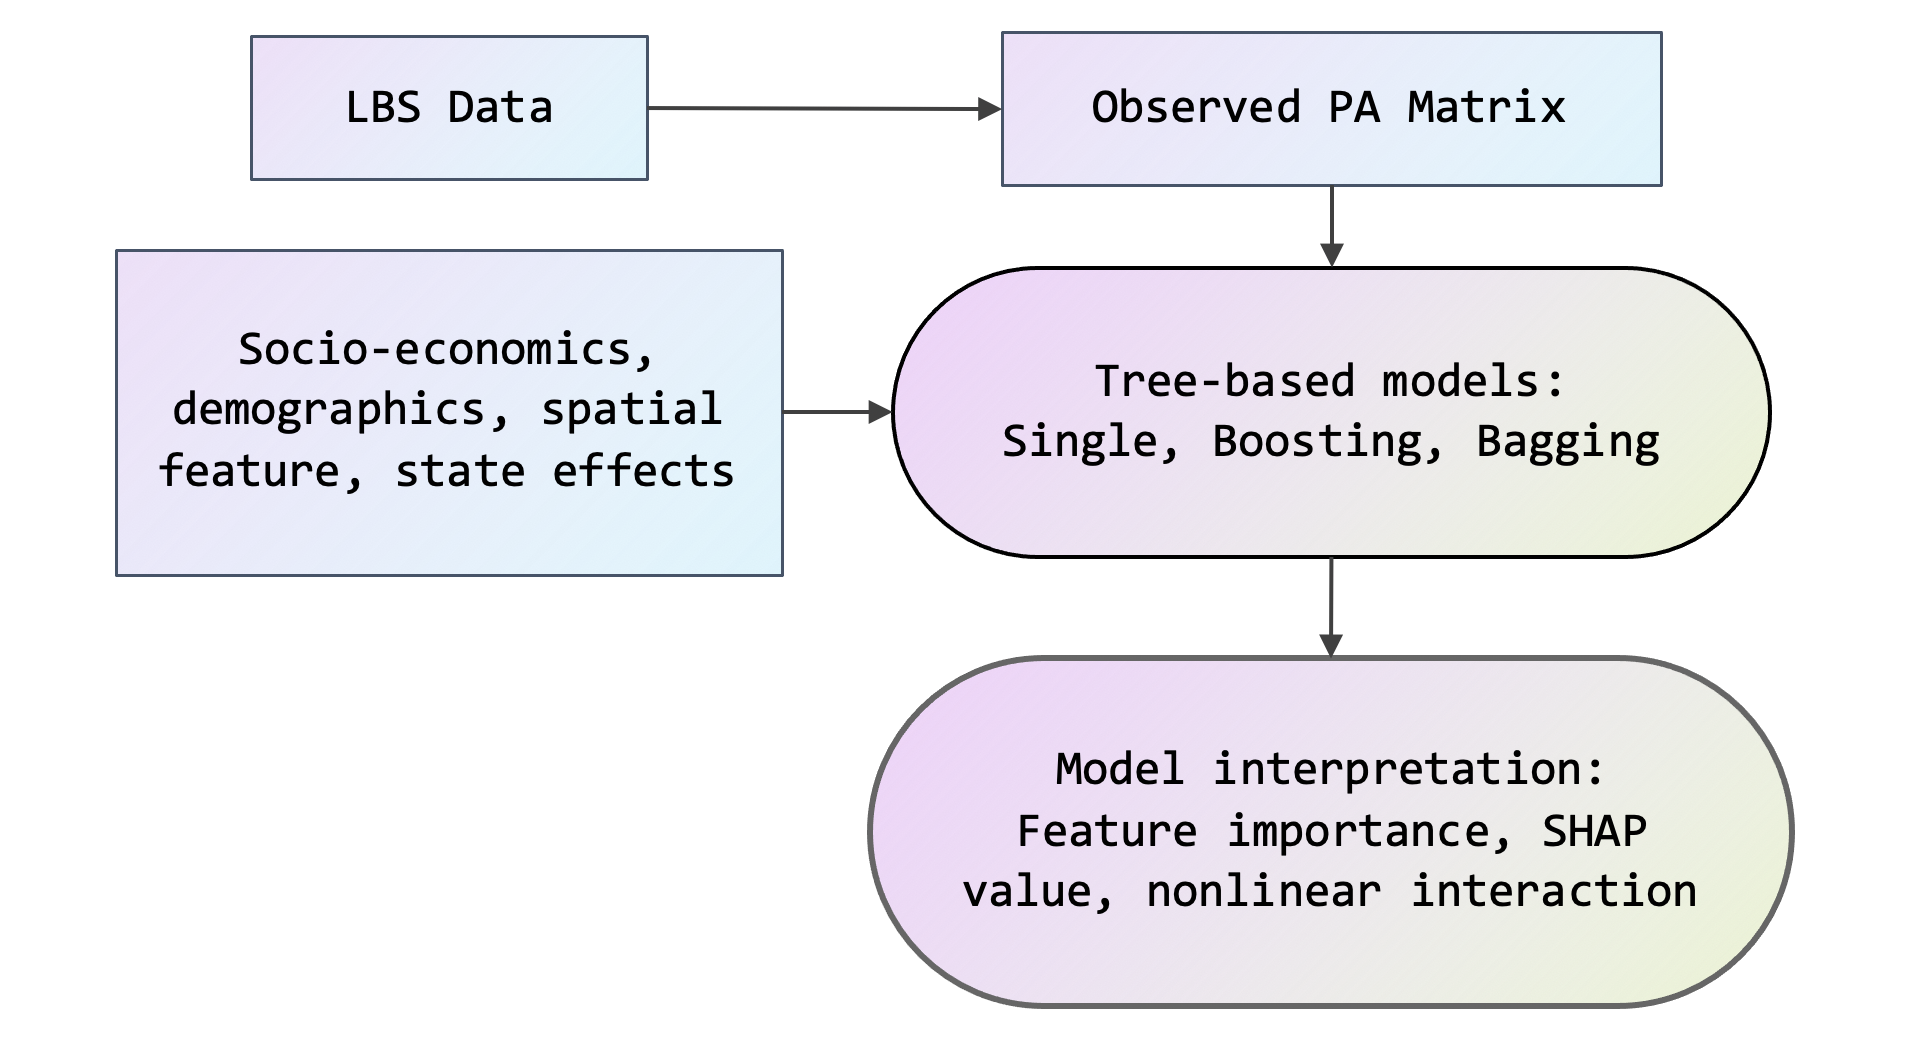
Figure 1a. Framework of human mobility prediction and interpretation.
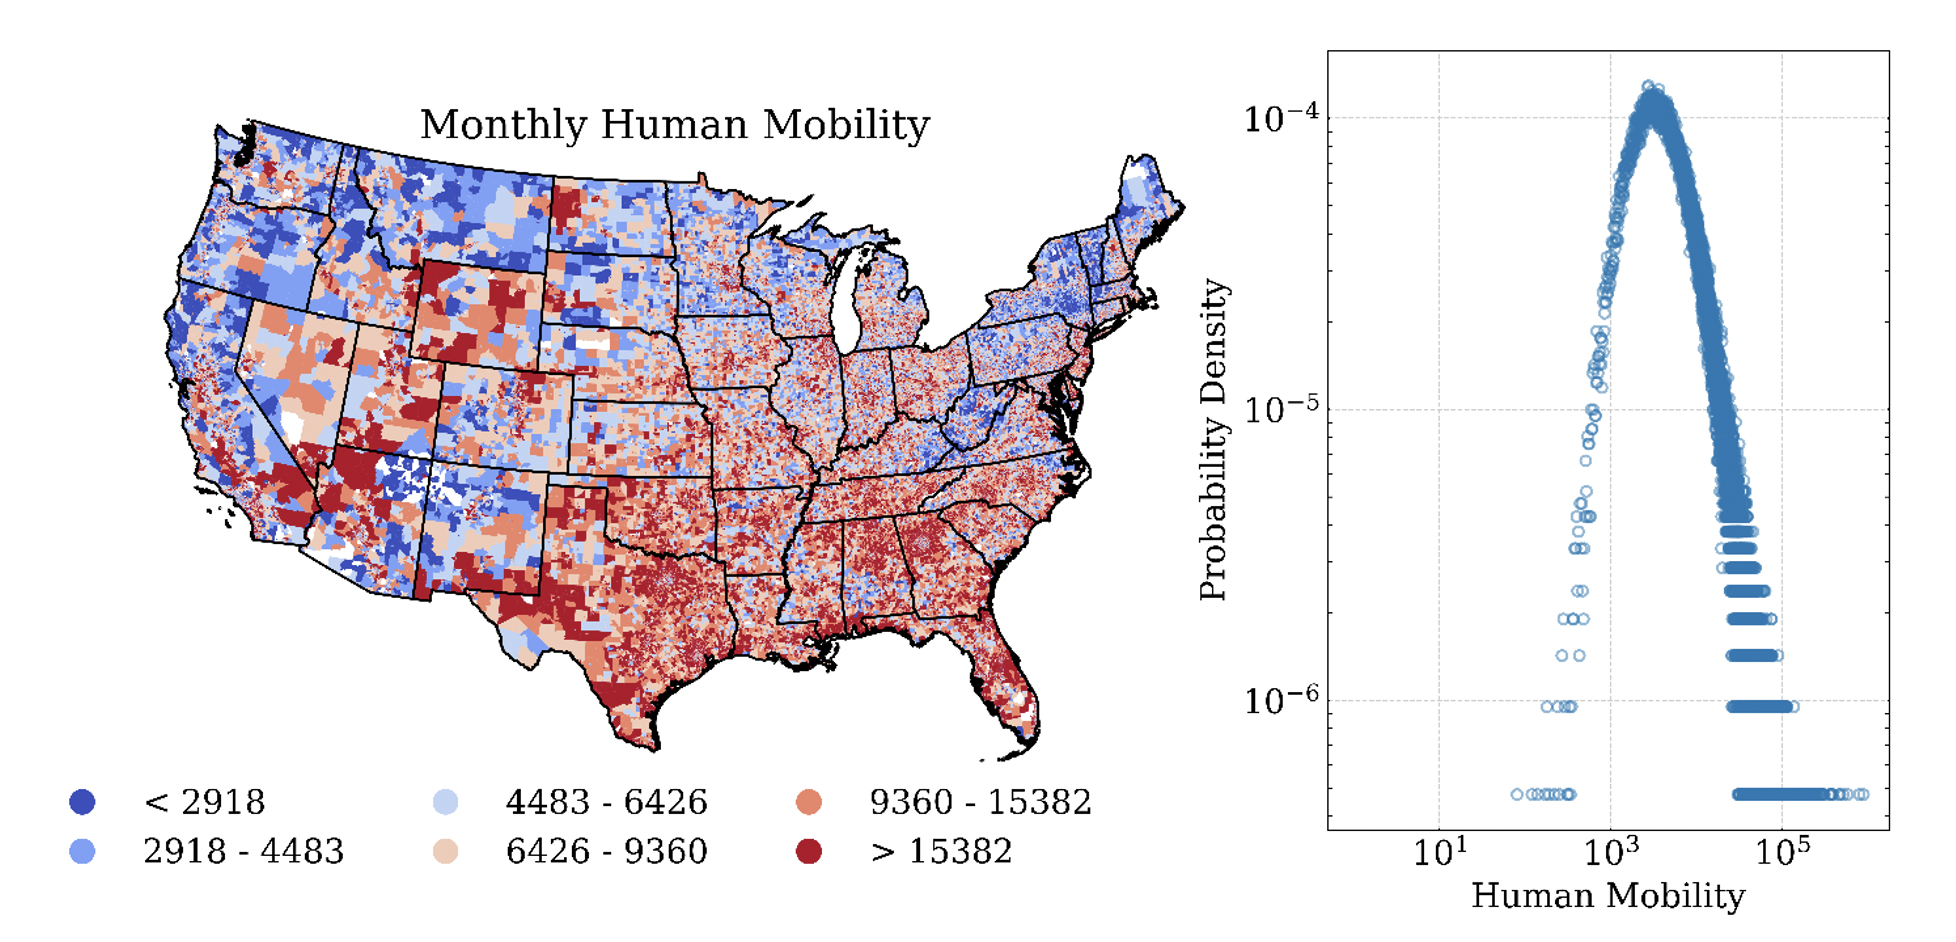
Figure 1b. Spatial and probability distribution of human mobility.
This study aims to introduce and compare a set of tree-based approaches for human mobility prediction and interpretation. A variety of cutting-edge tree-based technologies are fitted and compared, including bagging-based ensemble trees (random forests and extra-trees) and boosting-based ensemble trees (CatBoost [2], LightGBM [3], and XGBoost [4]).
Various exogenous variables are included, endowing the framework with sensitivity in socioeconomics, demographics, spatial features, and state effects. To better understand the underlying patterns learned by the models, several post hoc approaches are employed to interpret the fitted models, such as feature importance [5] and partial dependence plot based on SHAP value [6]. Our proposed framework can serve as a travel demand forecasting module in the transportation planning process. Outcomes can be fed into dynamic traffic assignment to obtain link-level traffic conditions in future scenarios.
Data Sources
References
Title: Factor Assessment on NYC Car Crash Severity
Author: Zhouoxuan Cao, Bincheng Yu
Abstract: On average, automobile accidents in NYC cause 1,098 deaths annually, 12093 hospitalizations, and 136,913 emergency department visits (Shaaban et al., 2021). Motor vehicle traffic crashes had become the primary cause of injury-related death among New York residents (Weiss et al., 2004).
In a step toward helping New York transportation agencies mitigate the poor traffic conditions by reducing car collisions, we will use the NYC car collision dataset (see Fig. 2a), which is owned by NYC OpenData and provided by New York Police Department (NYPD), to identify what factors would be related to car collisions.
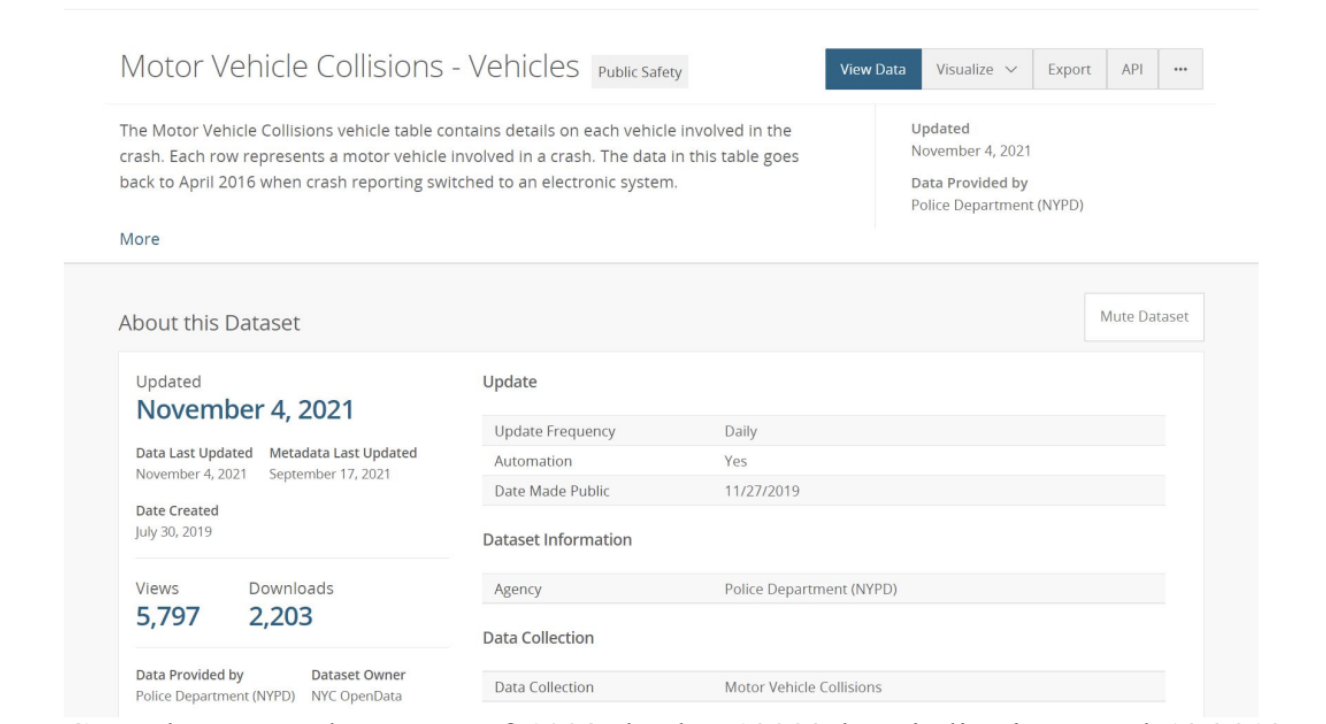
Figure 2a. Dataset for motor vehicle collisions in NYC.
The car collision dataset contains over 3.6 million observations and 21 variables, such as contribution factor, car make, and collision severity. Leveraging the enormous amount of data, we could build up high-accuracy clustering and regression machine learning models. The output of the regression model will reveal both the significant factors. And the groups generated by the clustering model will indicate what combination of these factors would lead to severe collisions. Previous studies conventionally use fatality and injury to measure collision severity, but an overwhelming majority of the crashes will cause car damage or property loss without any injury. Therefore, the independent variable, collision severity, will be defined by car damage severity in this project.
Data Sources
The data is acquired from three sources: freemeteo.com - weather data
References
Title: Prediction of the Emergence of Gentrification using OpenStreetMap Data
Authors: Man Liang and Alibi Shokputov
Abstract: Gentrification is the change of neighborhood through the influx of more affluent residents and businesses. It shifts the composition of a neighborhood by developing new and expensive housing and business. The impact of gentrification on the neighborhood is two-fold. It could benefit the community with increased economic value, but may also result in demographic displacement. Therefore, understanding the future trends of gentrification is of great importance for city decision-makers.
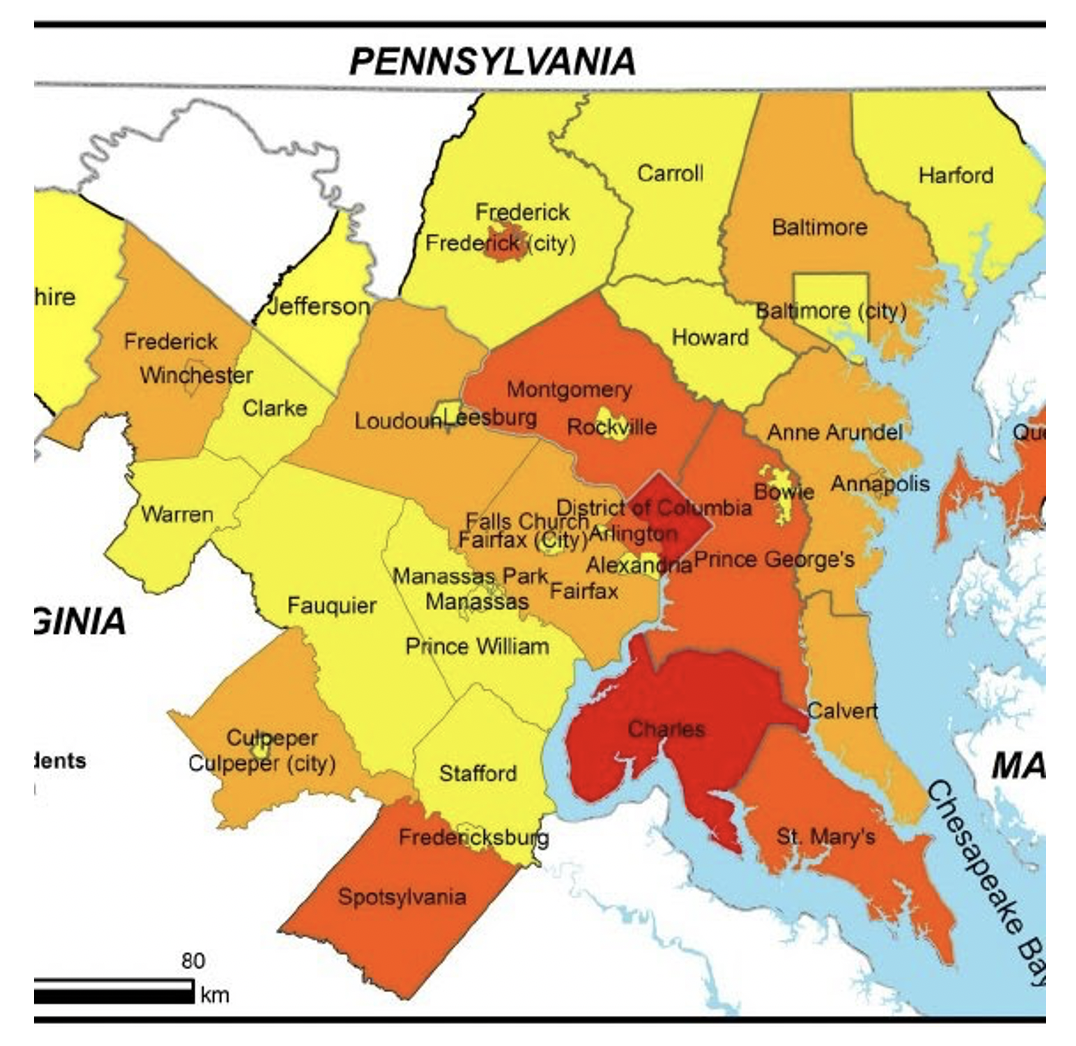
Figure 3a. Counties in the Washington DC Area.
The goal of this study is to predict the future emergence of gentrification in neighborhoods most susceptible to this process within the scope of the DMV area (see Fig. 3a) by applying the OpenStreetMap (OSM) data with a machine learning method (AutoEncoder).
OSM is an open-source database with a high spatiotemporal resolution. It provides rich statistics of an individual municipality. From the attributes provided in OSM, socio-economic indicators are generated in assessing and describing gentrification. This research aimed to analyze 4 indicators.
Indicators 1, 2, and 3 are identified by Van Criekingen and Decroly, Indicator 4 is added at the discretion of the author. In this study, we used machine learning to identify the predictors of the gentrification indicators based on OSM. As a result, future emergencies of gentrification are generalized and predicted.
Data Sources
The data is acquired from three sources: freemeteo.com - weather data
References
Last Modified: November 29, 2021,
Copyright © 2021, Department of Civil and Environmental Engineering, University of Maryland.